console.log for mental states
low friction input
dense visualization
Personal Data Logging with Analytics
TriLog is an iPhone app for keeping a record of how you feel and what you do — one timestamped entry at a time — and reading it back over days, weeks, and months.
Programmers use console.log to write a line to a log whenever something worth noting happens,
so that later they can see what actually went on instead of guessing. TriLog does that for the things only
you can observe: your energy, your mood, a headache, a coffee, a bad night, a good conversation.
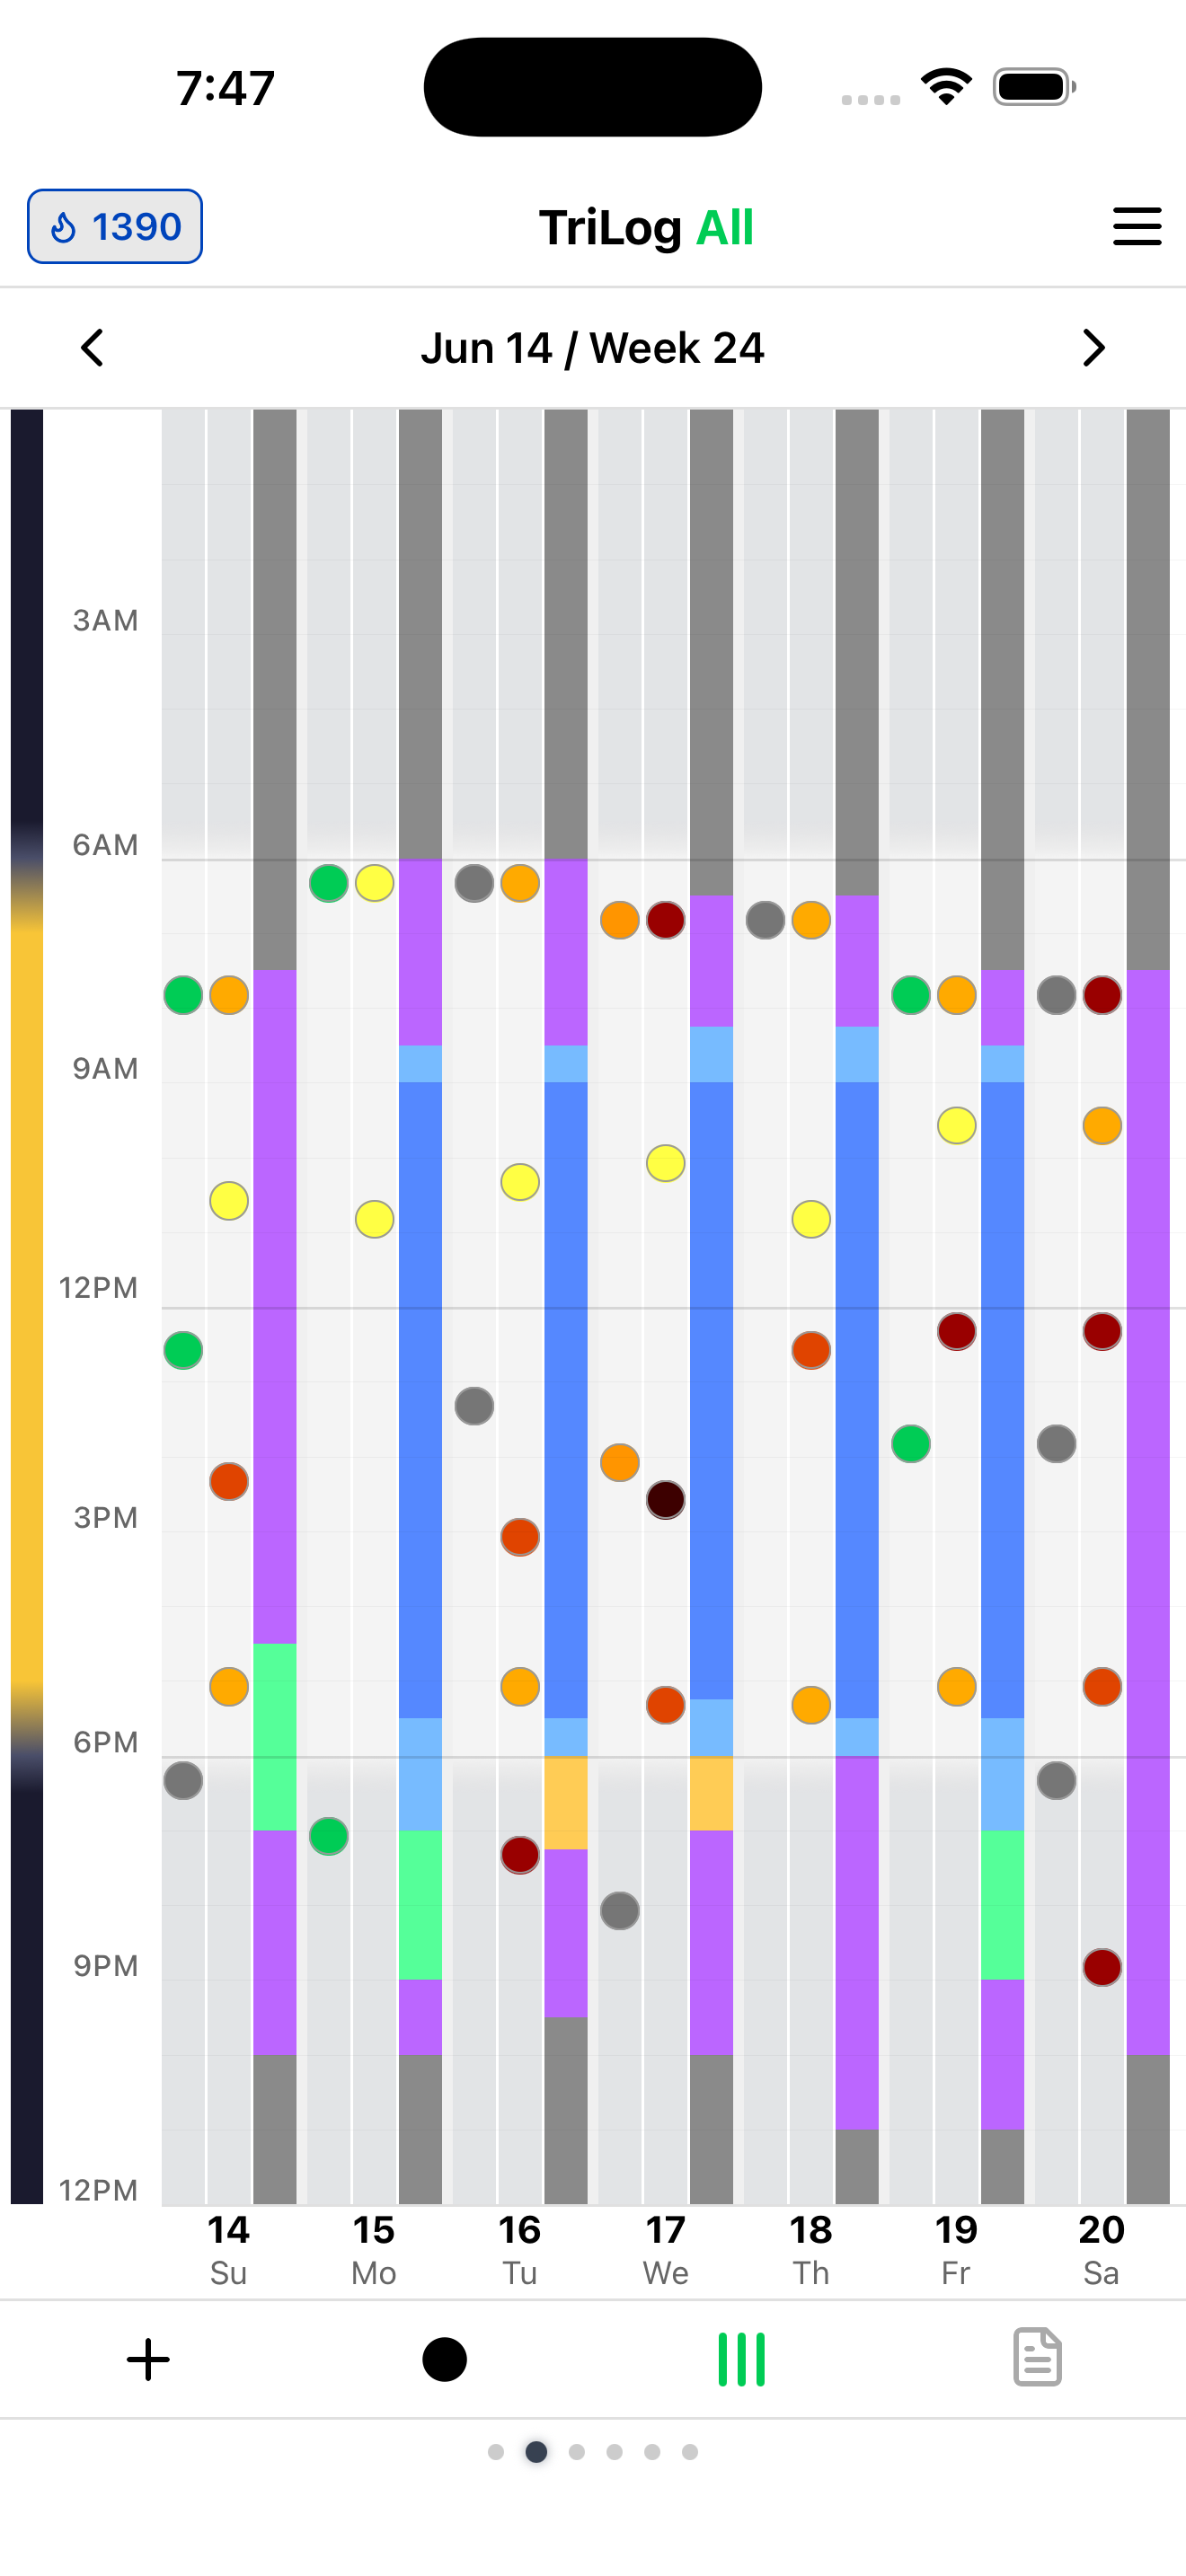
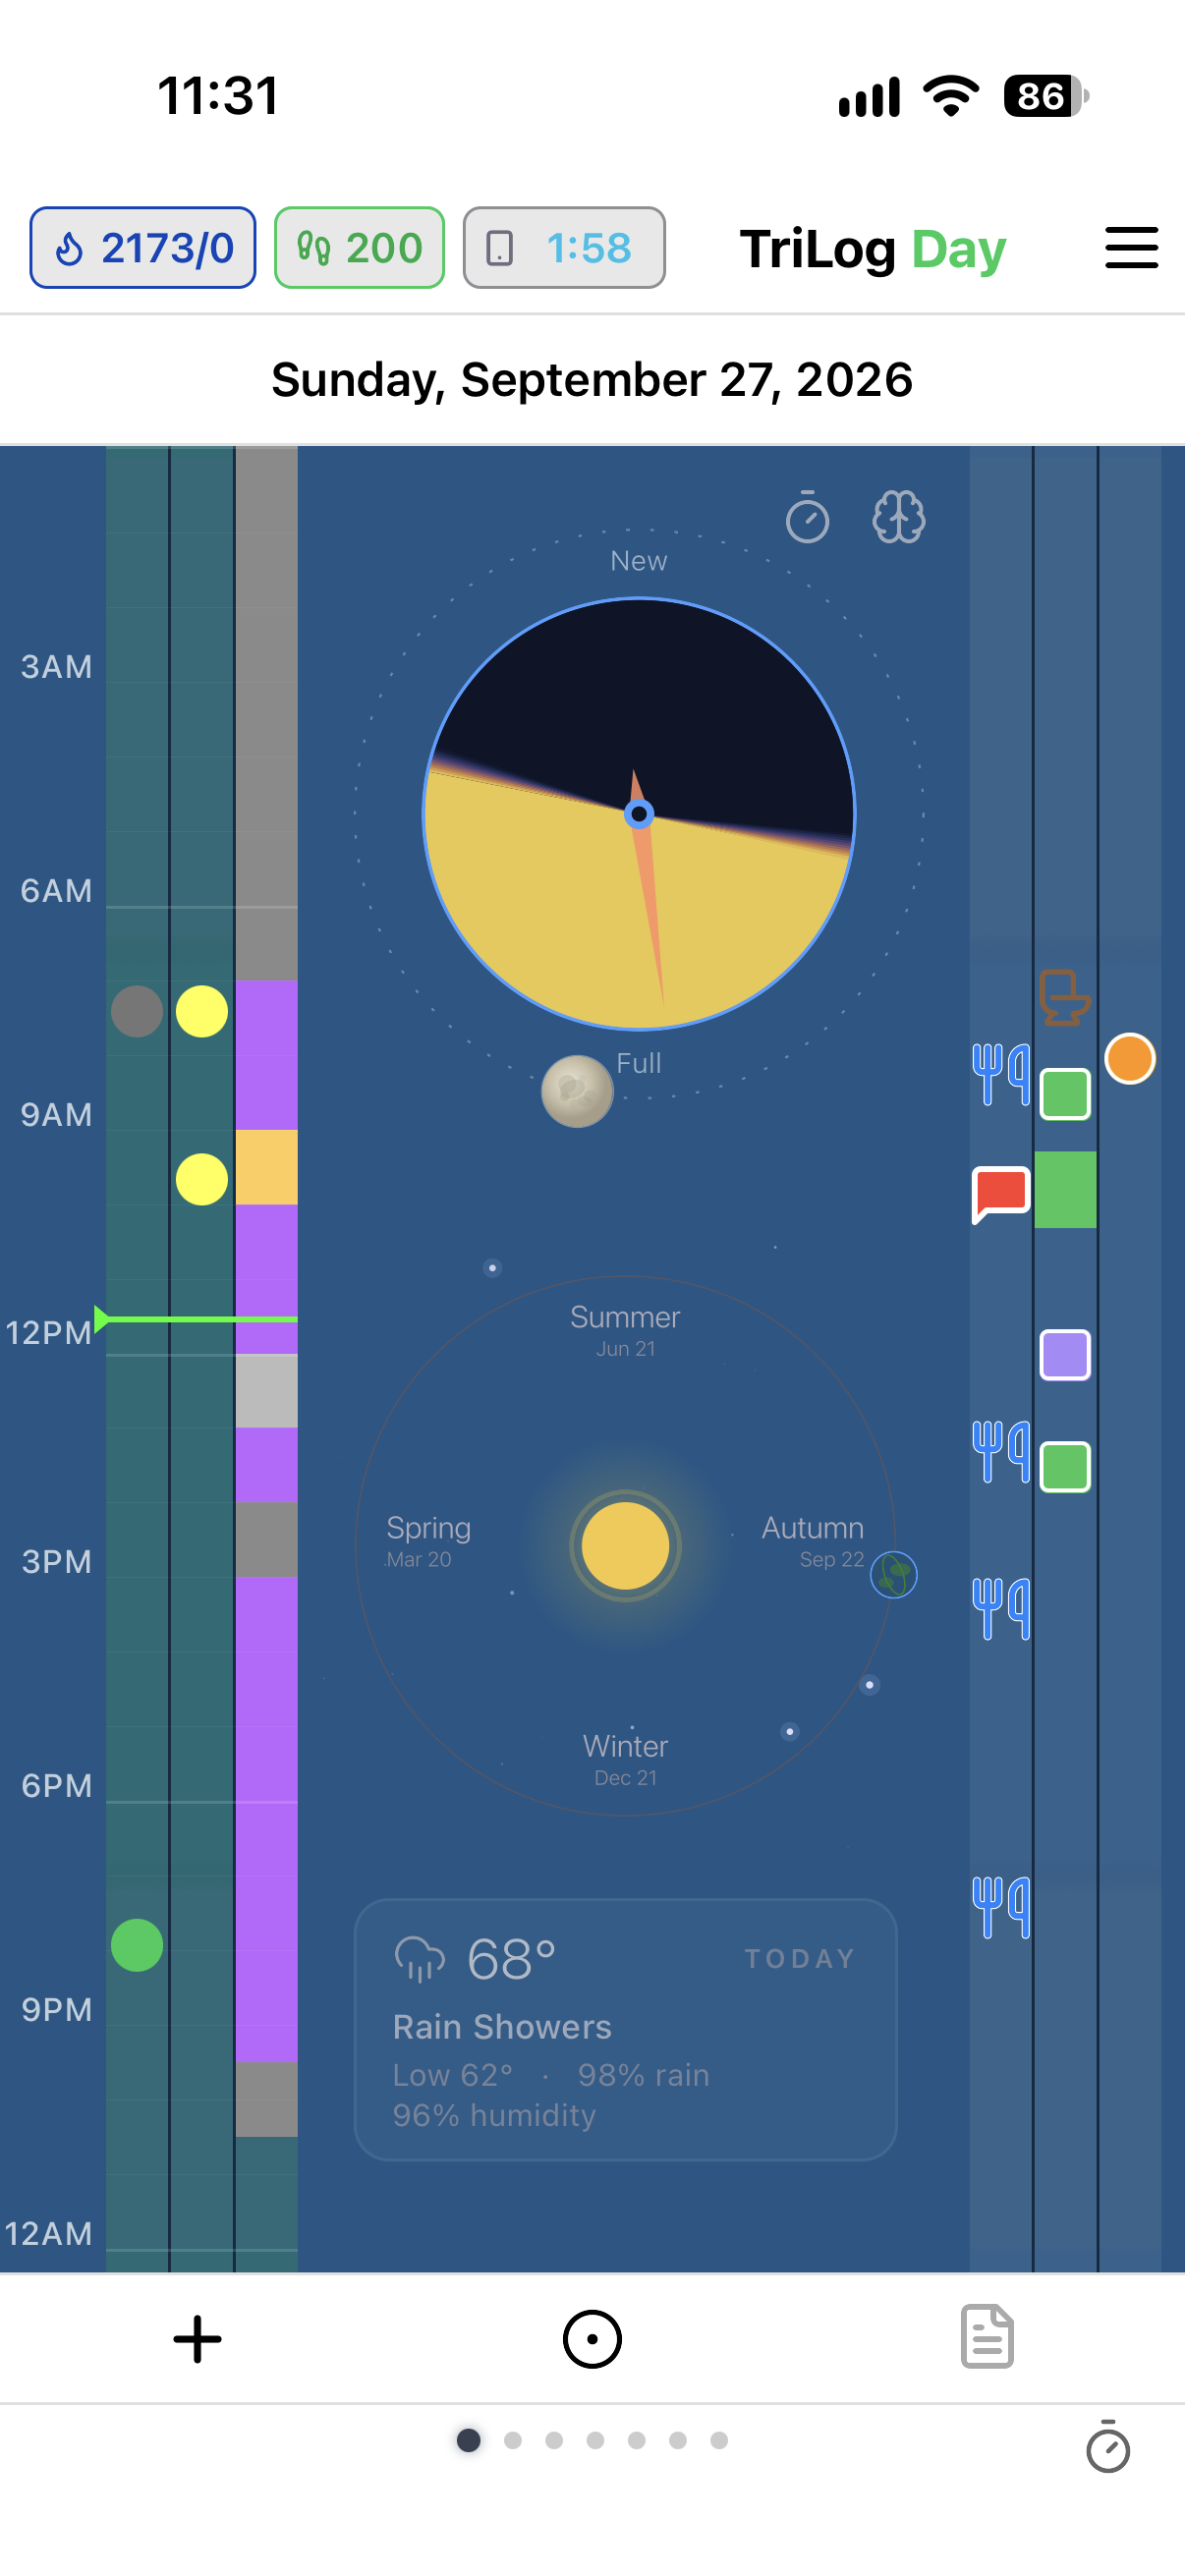
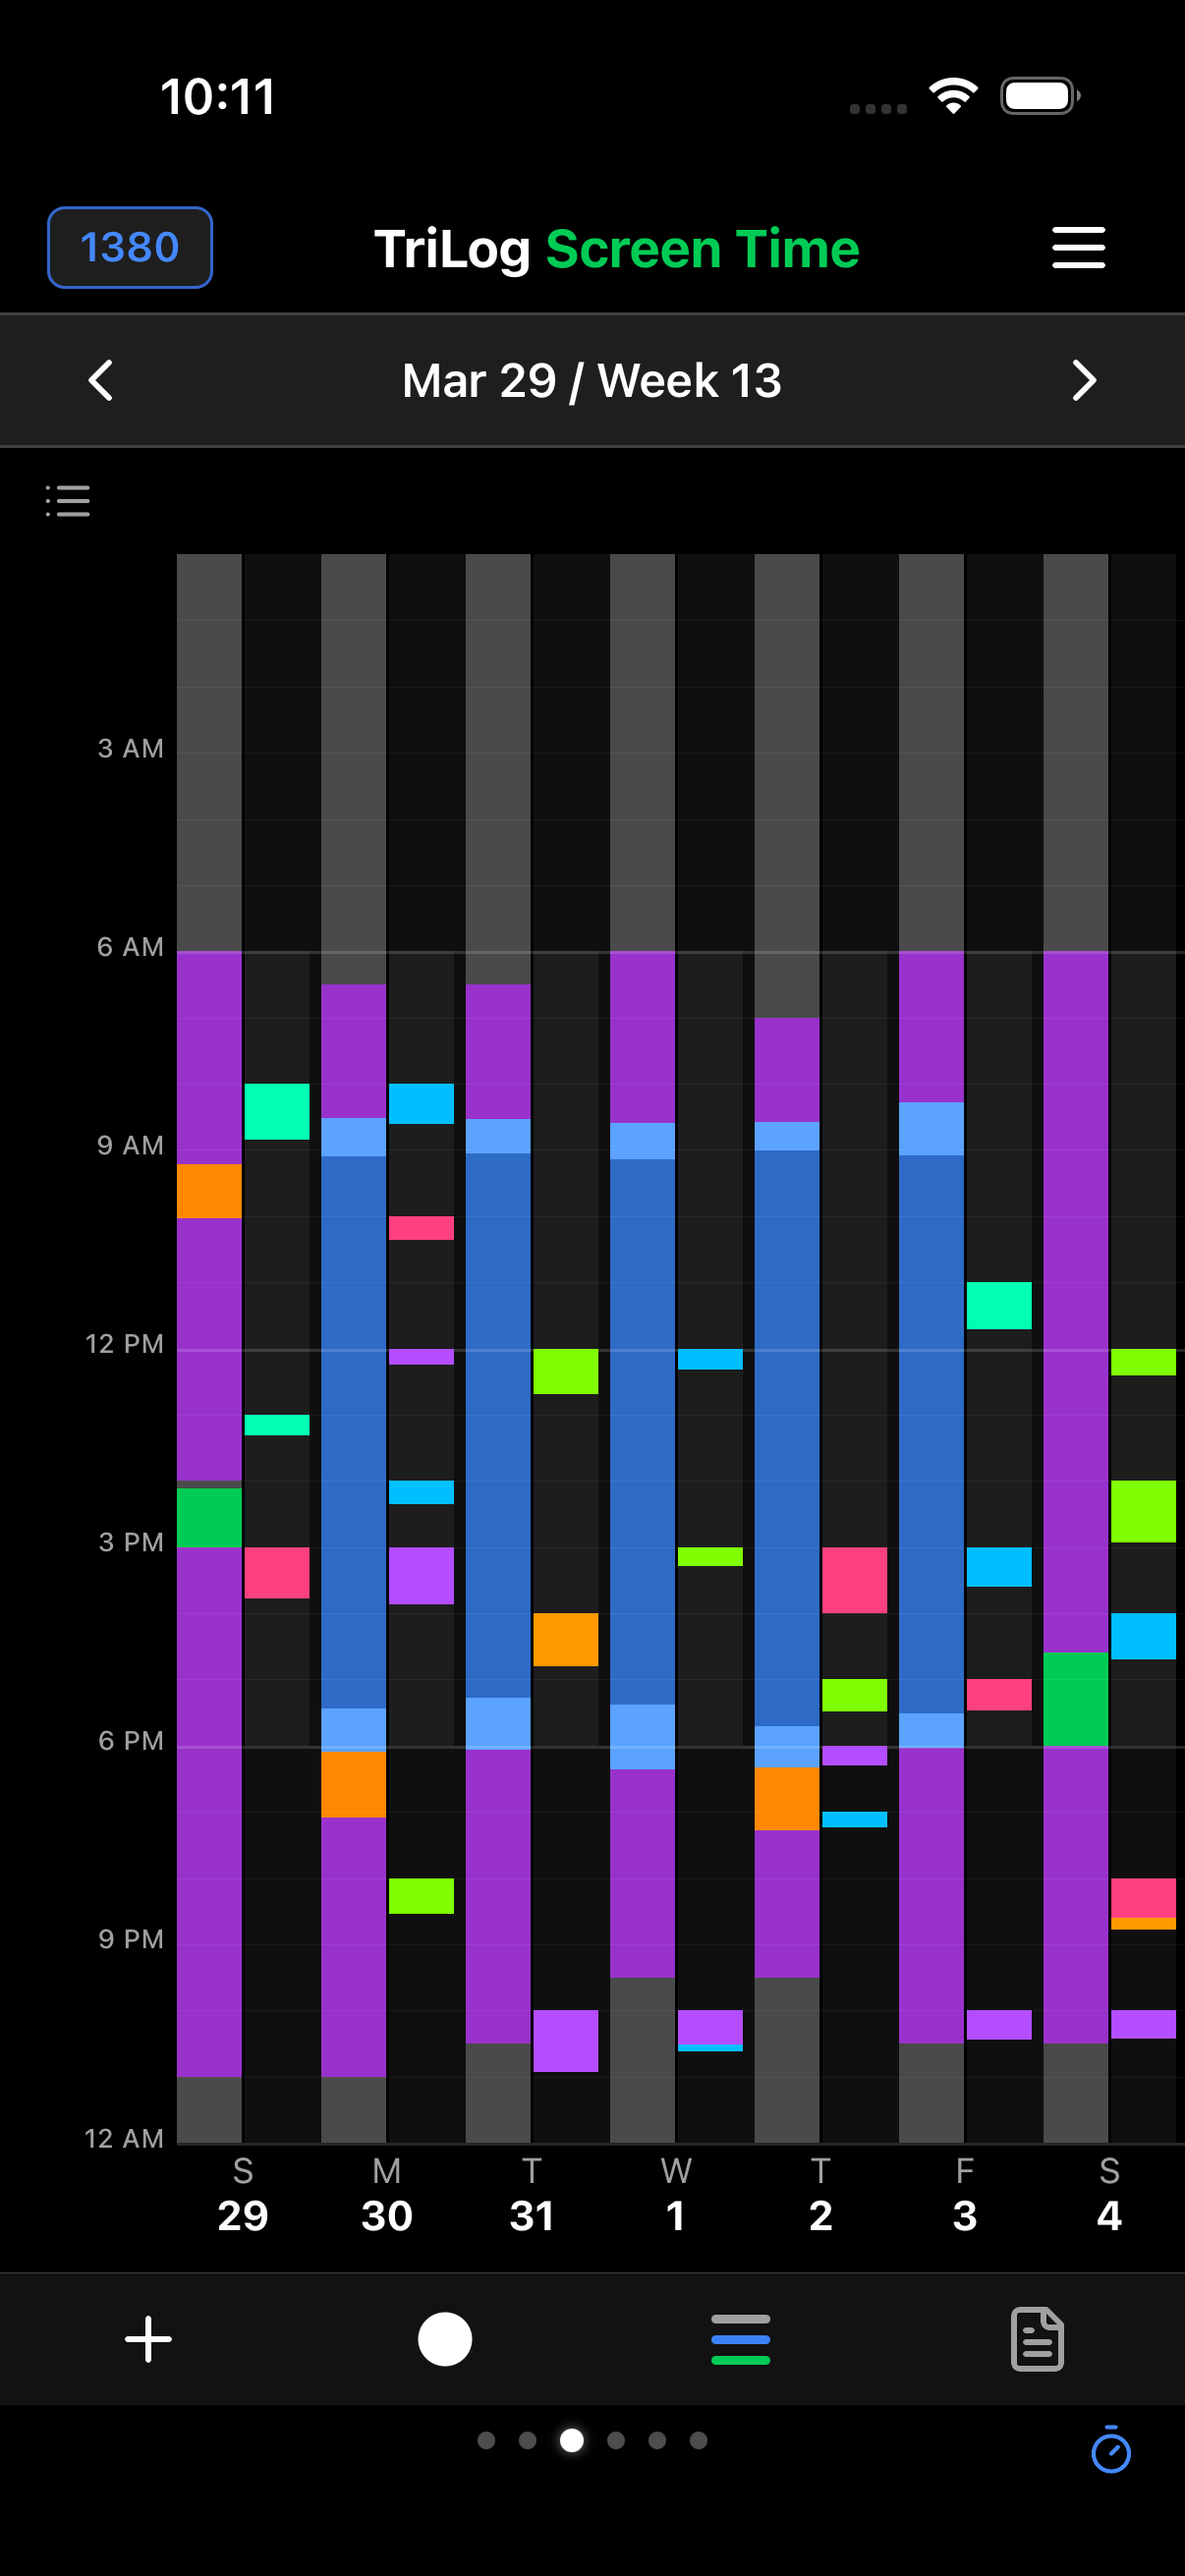
Entering something takes a tap or a line of text. Viewing it is dense on purpose: a whole week, hour by hour, on one screen, next to the weather, your sleep, and Apple Health.
SWIPE →
01What you can log
- Energy, mood, activity
- The three core measures. Energy is 1–5, mood is one of five emotions, activity is what you’re doing (sleep, work, exercise…). One tap each.
- Event notes
- A line of text tied to a moment. Start it with a short prefix to give it a type:
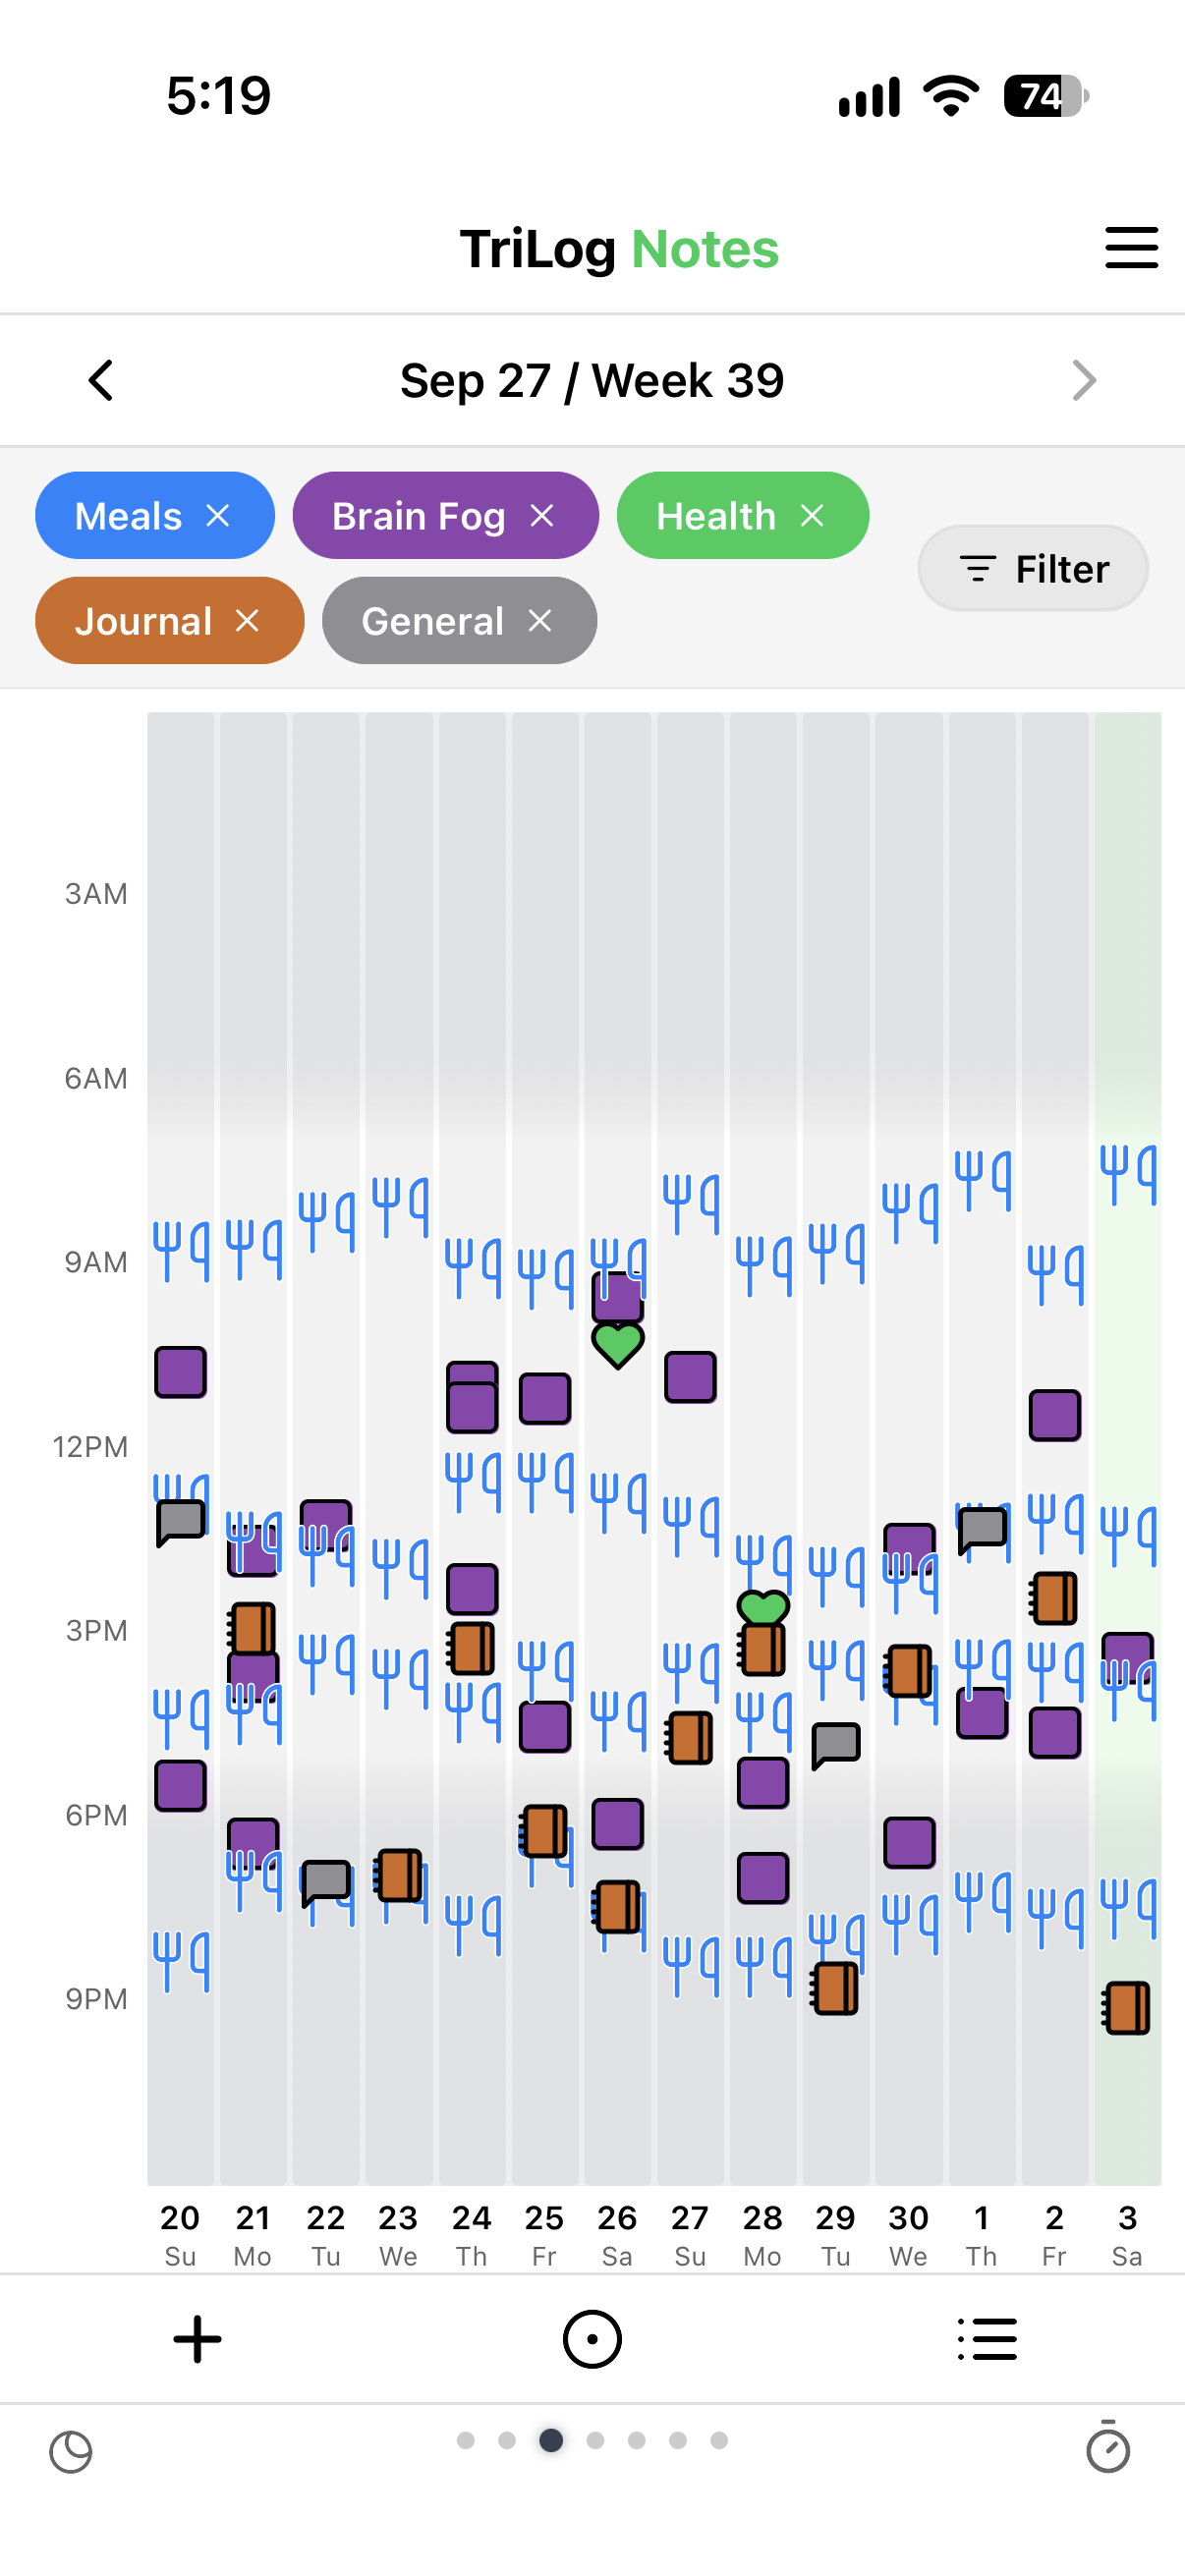
mmeal (with calories),hhealth,jjournal,cycycle. - Day notes
- Day End covers the whole day: an overall rating, today’s goals and tomorrow’s, a journal reflection, habits, and one-value-per-day trackers. Day Launch covers the morning: last night’s sleep and today’s plan.
- Trackers
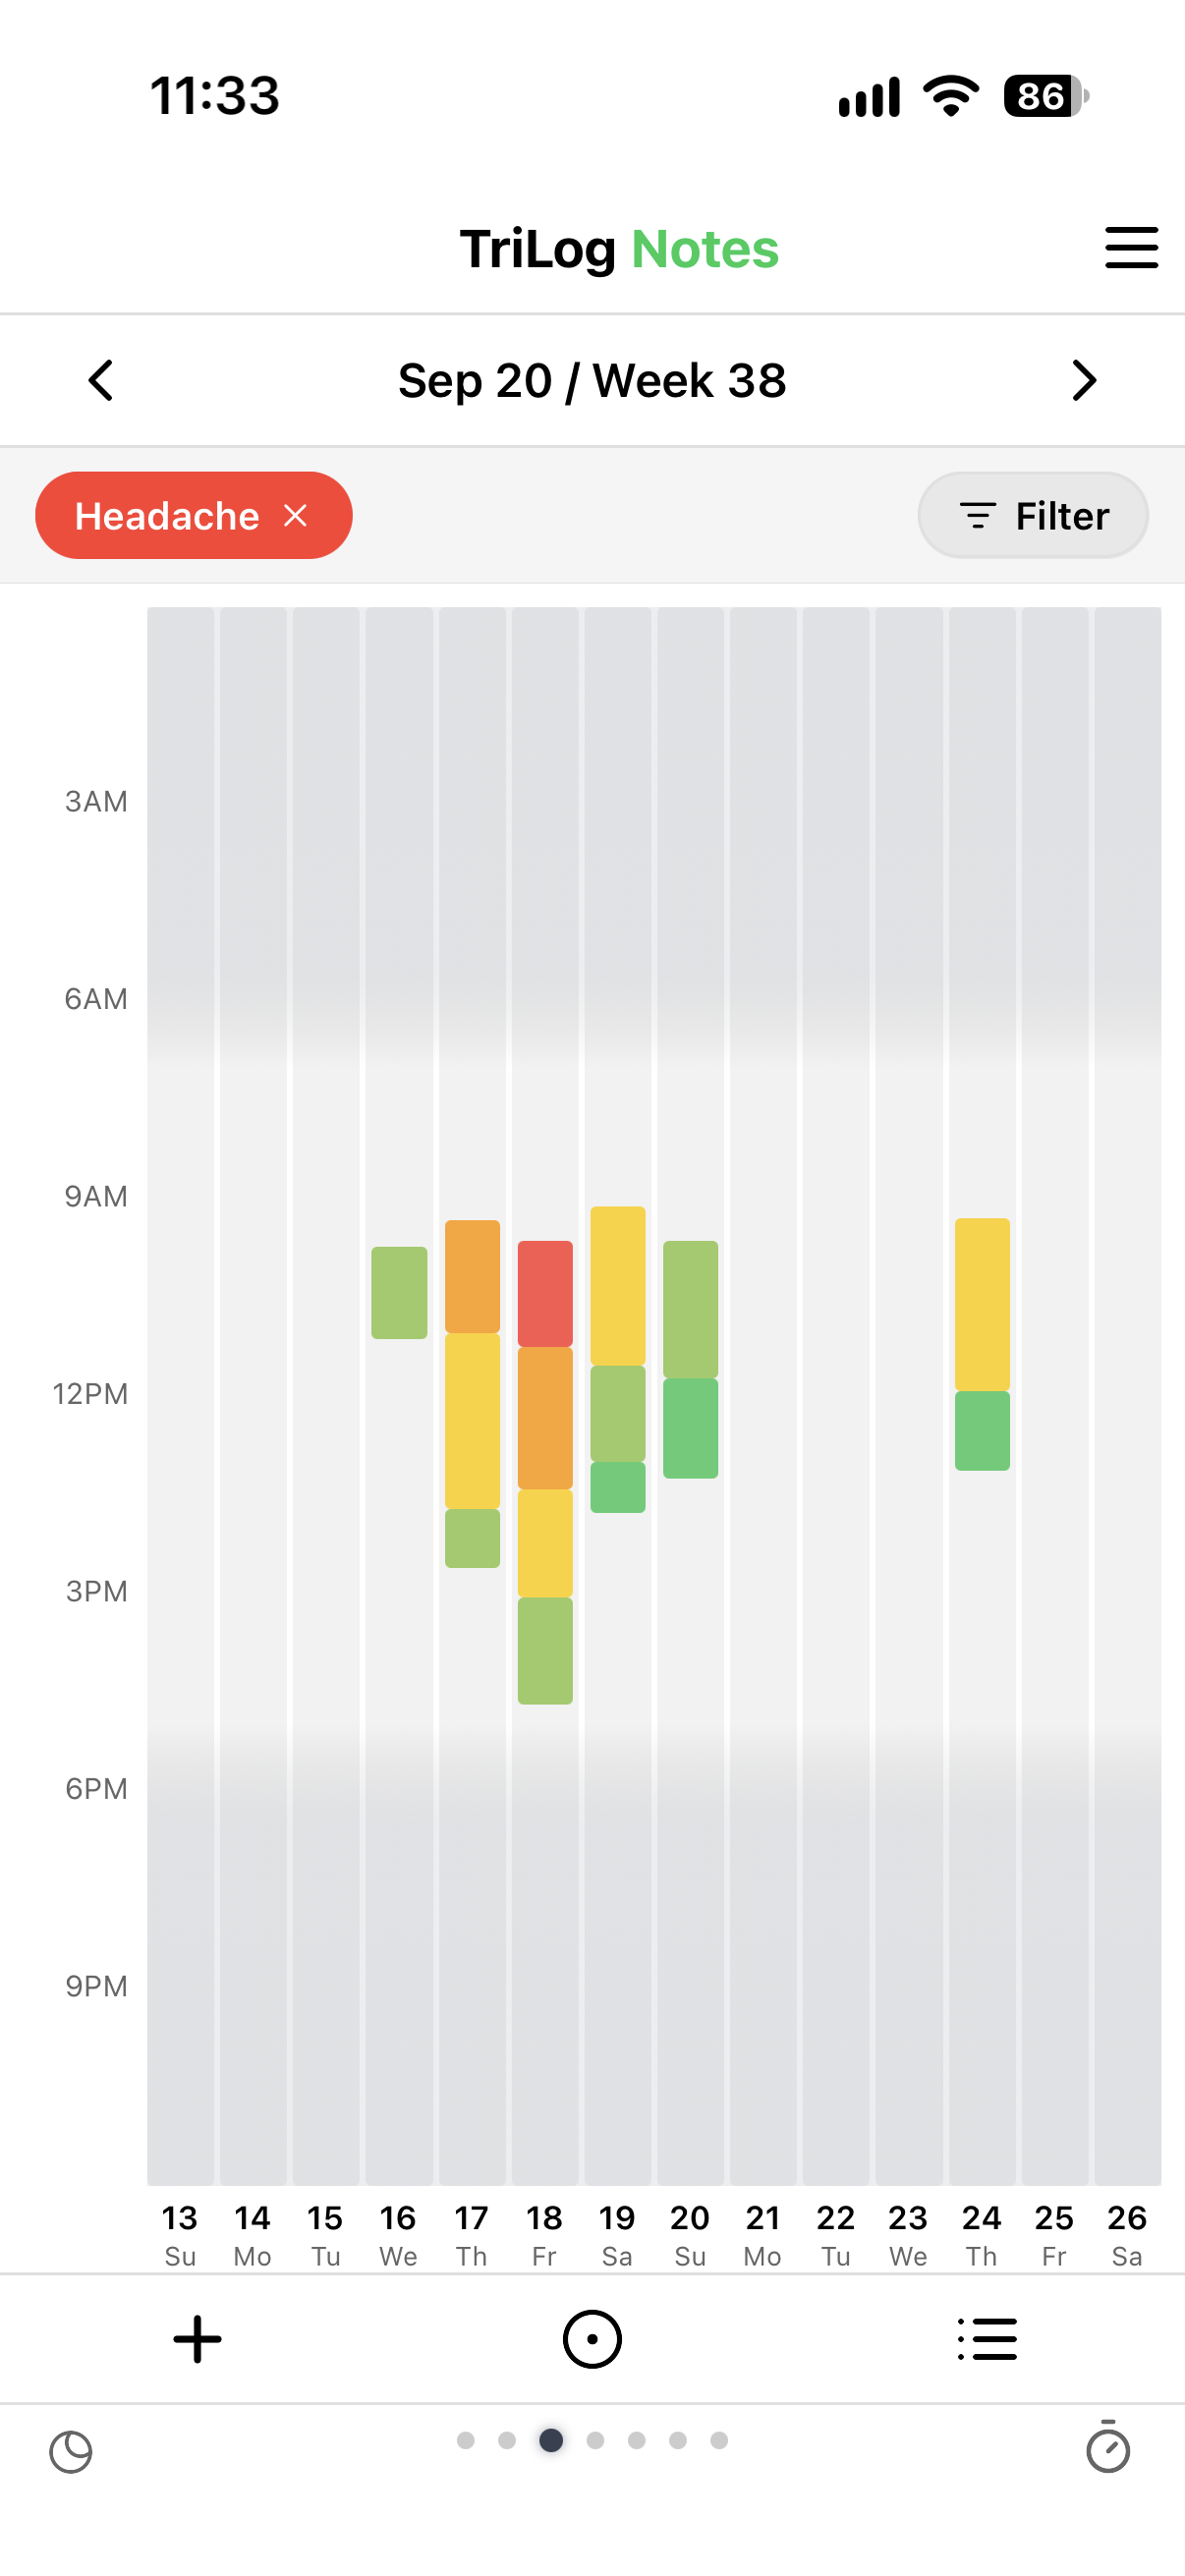
- Note types you define yourself — a headache rating, a focus level, a movie review — each with the kind of value it takes (a rating, a number, a choice, an episode with a start and stop).
- Intake
- A library of things you take — coffee, supplements, medication, alcohol — logged with amounts and units. Caffeine adds up in milligrams.
- Forms
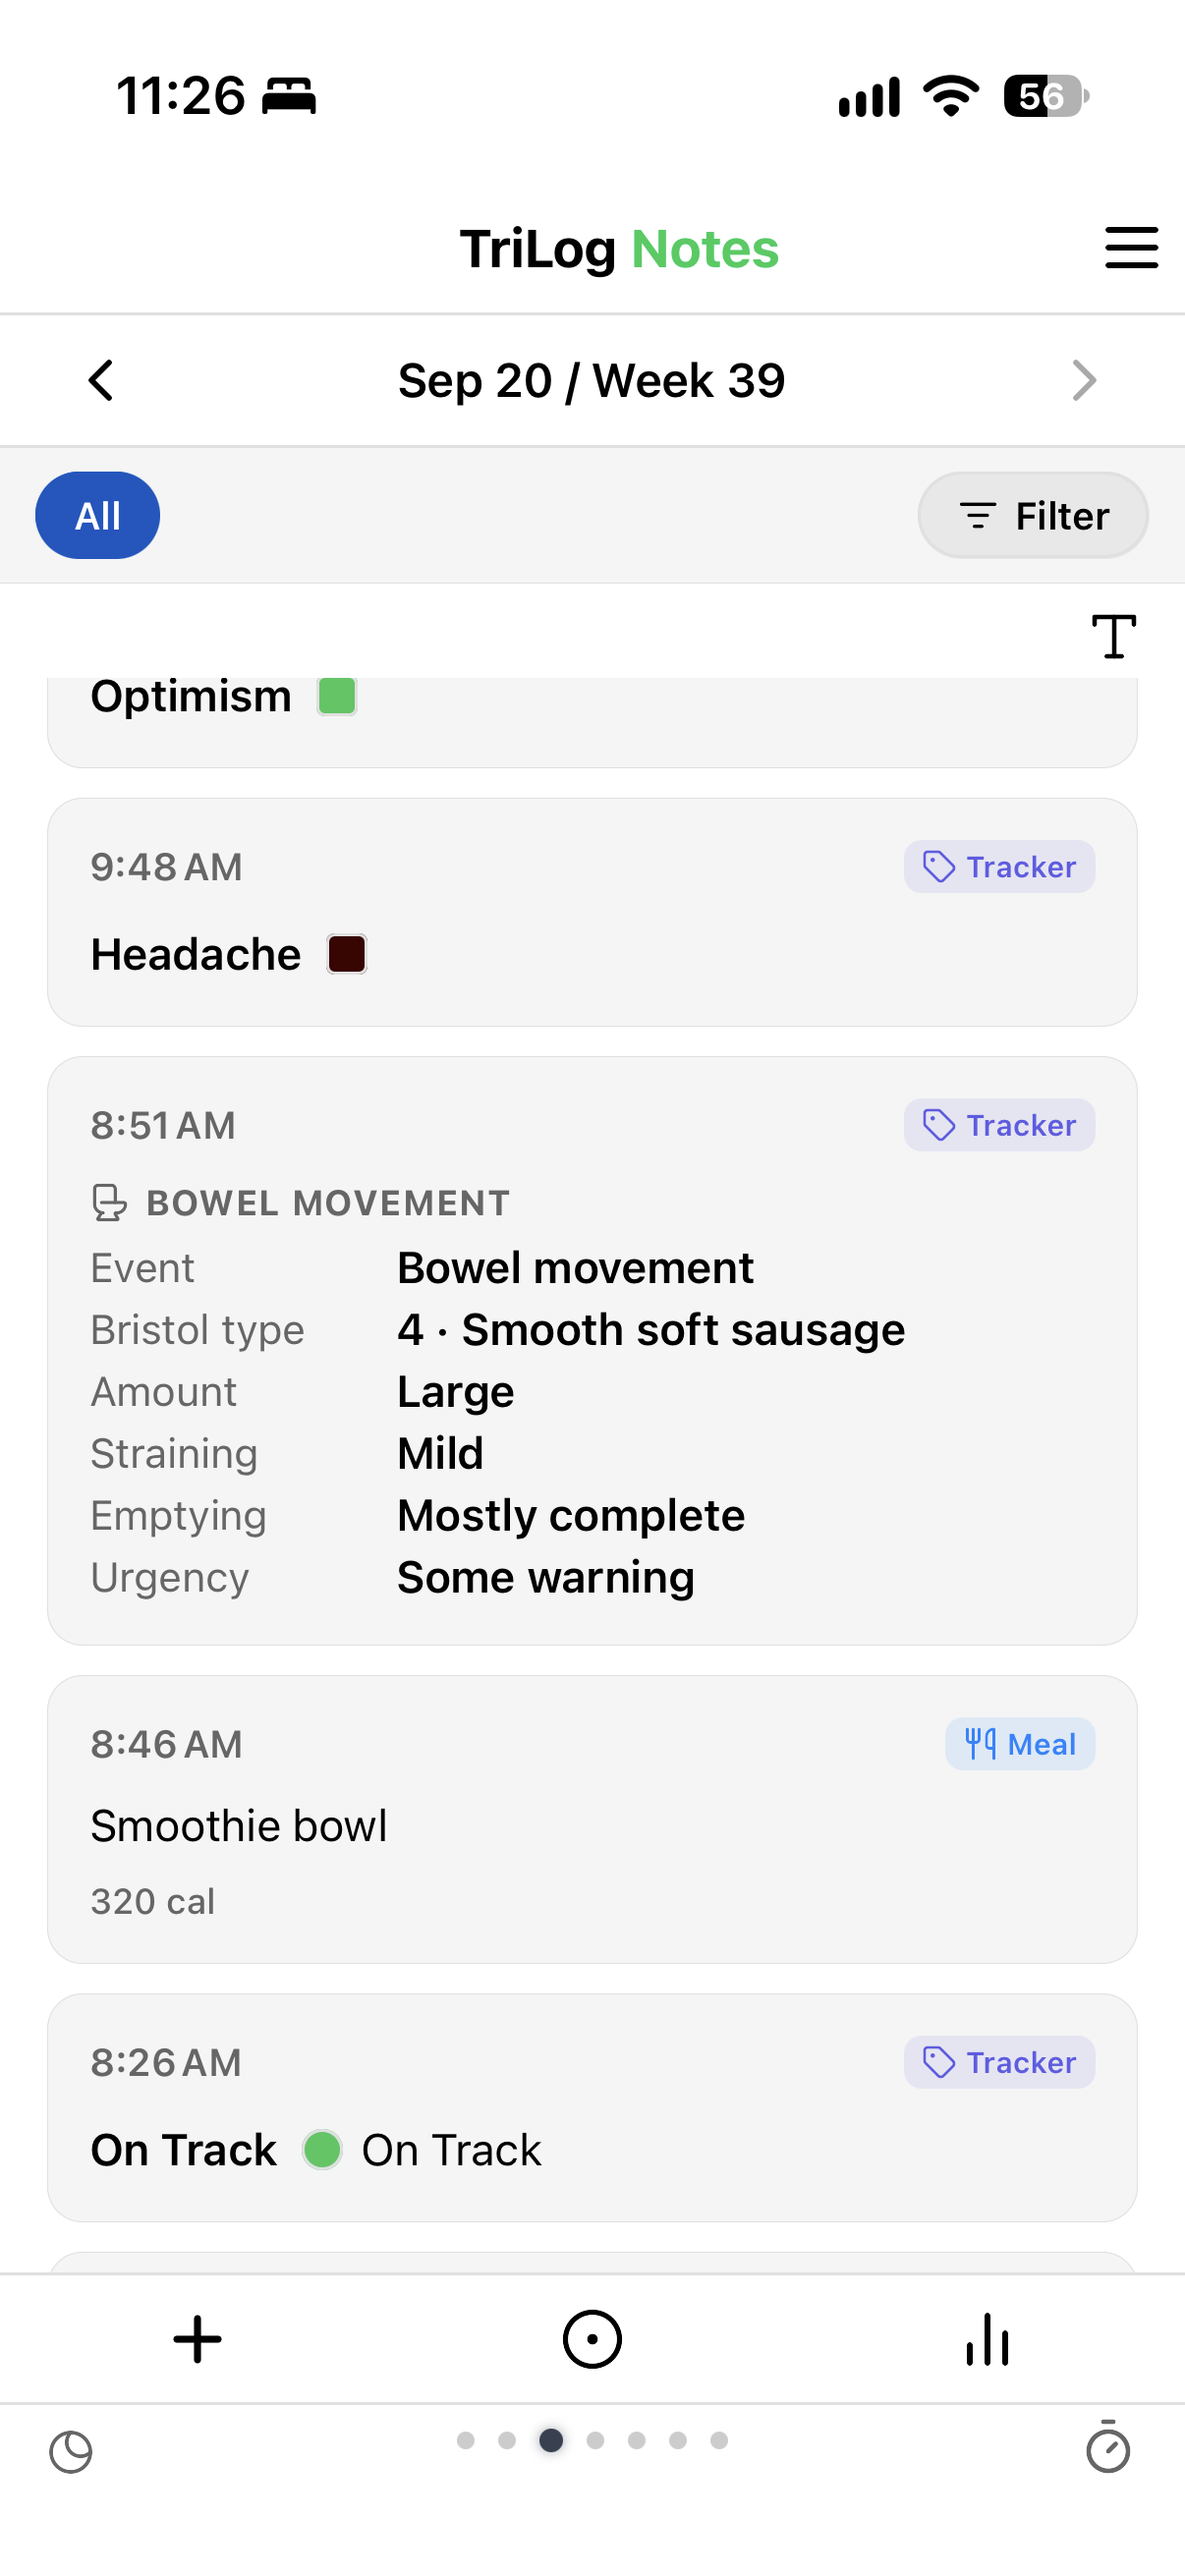
- Several fields filled in together and saved as one entry — a pain episode, a bowel event, a restaurant visit. Every field can be charted on its own.
- Trials
- Time-boxed experiments: try something for a while, mark the days you missed, then keep it or drop it.
- Habits
- Simple daily checkmarks. No streaks, no scores.
Some context comes in on its own: weather, barometric pressure, pollen, air quality, daylight, and moon phase; steps, sleep, heart rate, and workouts from Apple Health; and hour-by-hour Screen Time.
02How you log it
- Add
- The full entry screen: measures, notes, trackers, intake, forms, and a time picker for anything you forgot to log earlier.
- Quick Track
- Leave it open and log with single taps, including trackers you pin to it.
- Text
- Everything can also be typed as a line —
t hd 3for a tracker,int coffeefor intake — with your own shorthand expansions. - Siri
- Log measures and notes by voice, without opening the app.
- On the chart
- Long-press a chart to add something at that time; drag a marker to change its time.
03How you see it
- Week chart
- Seven days, twenty-four hours: energy and mood as dots, activity as blocks, daylight shaded, notes as markers.
- Notes view
- Everything you logged in a week — notes, tracker entries, intake — as a filterable list or a two-week time-of-day chart.
- Trio & Day views
- A week chart with the three columns you choose, and a focused view of just today.
- Metrics
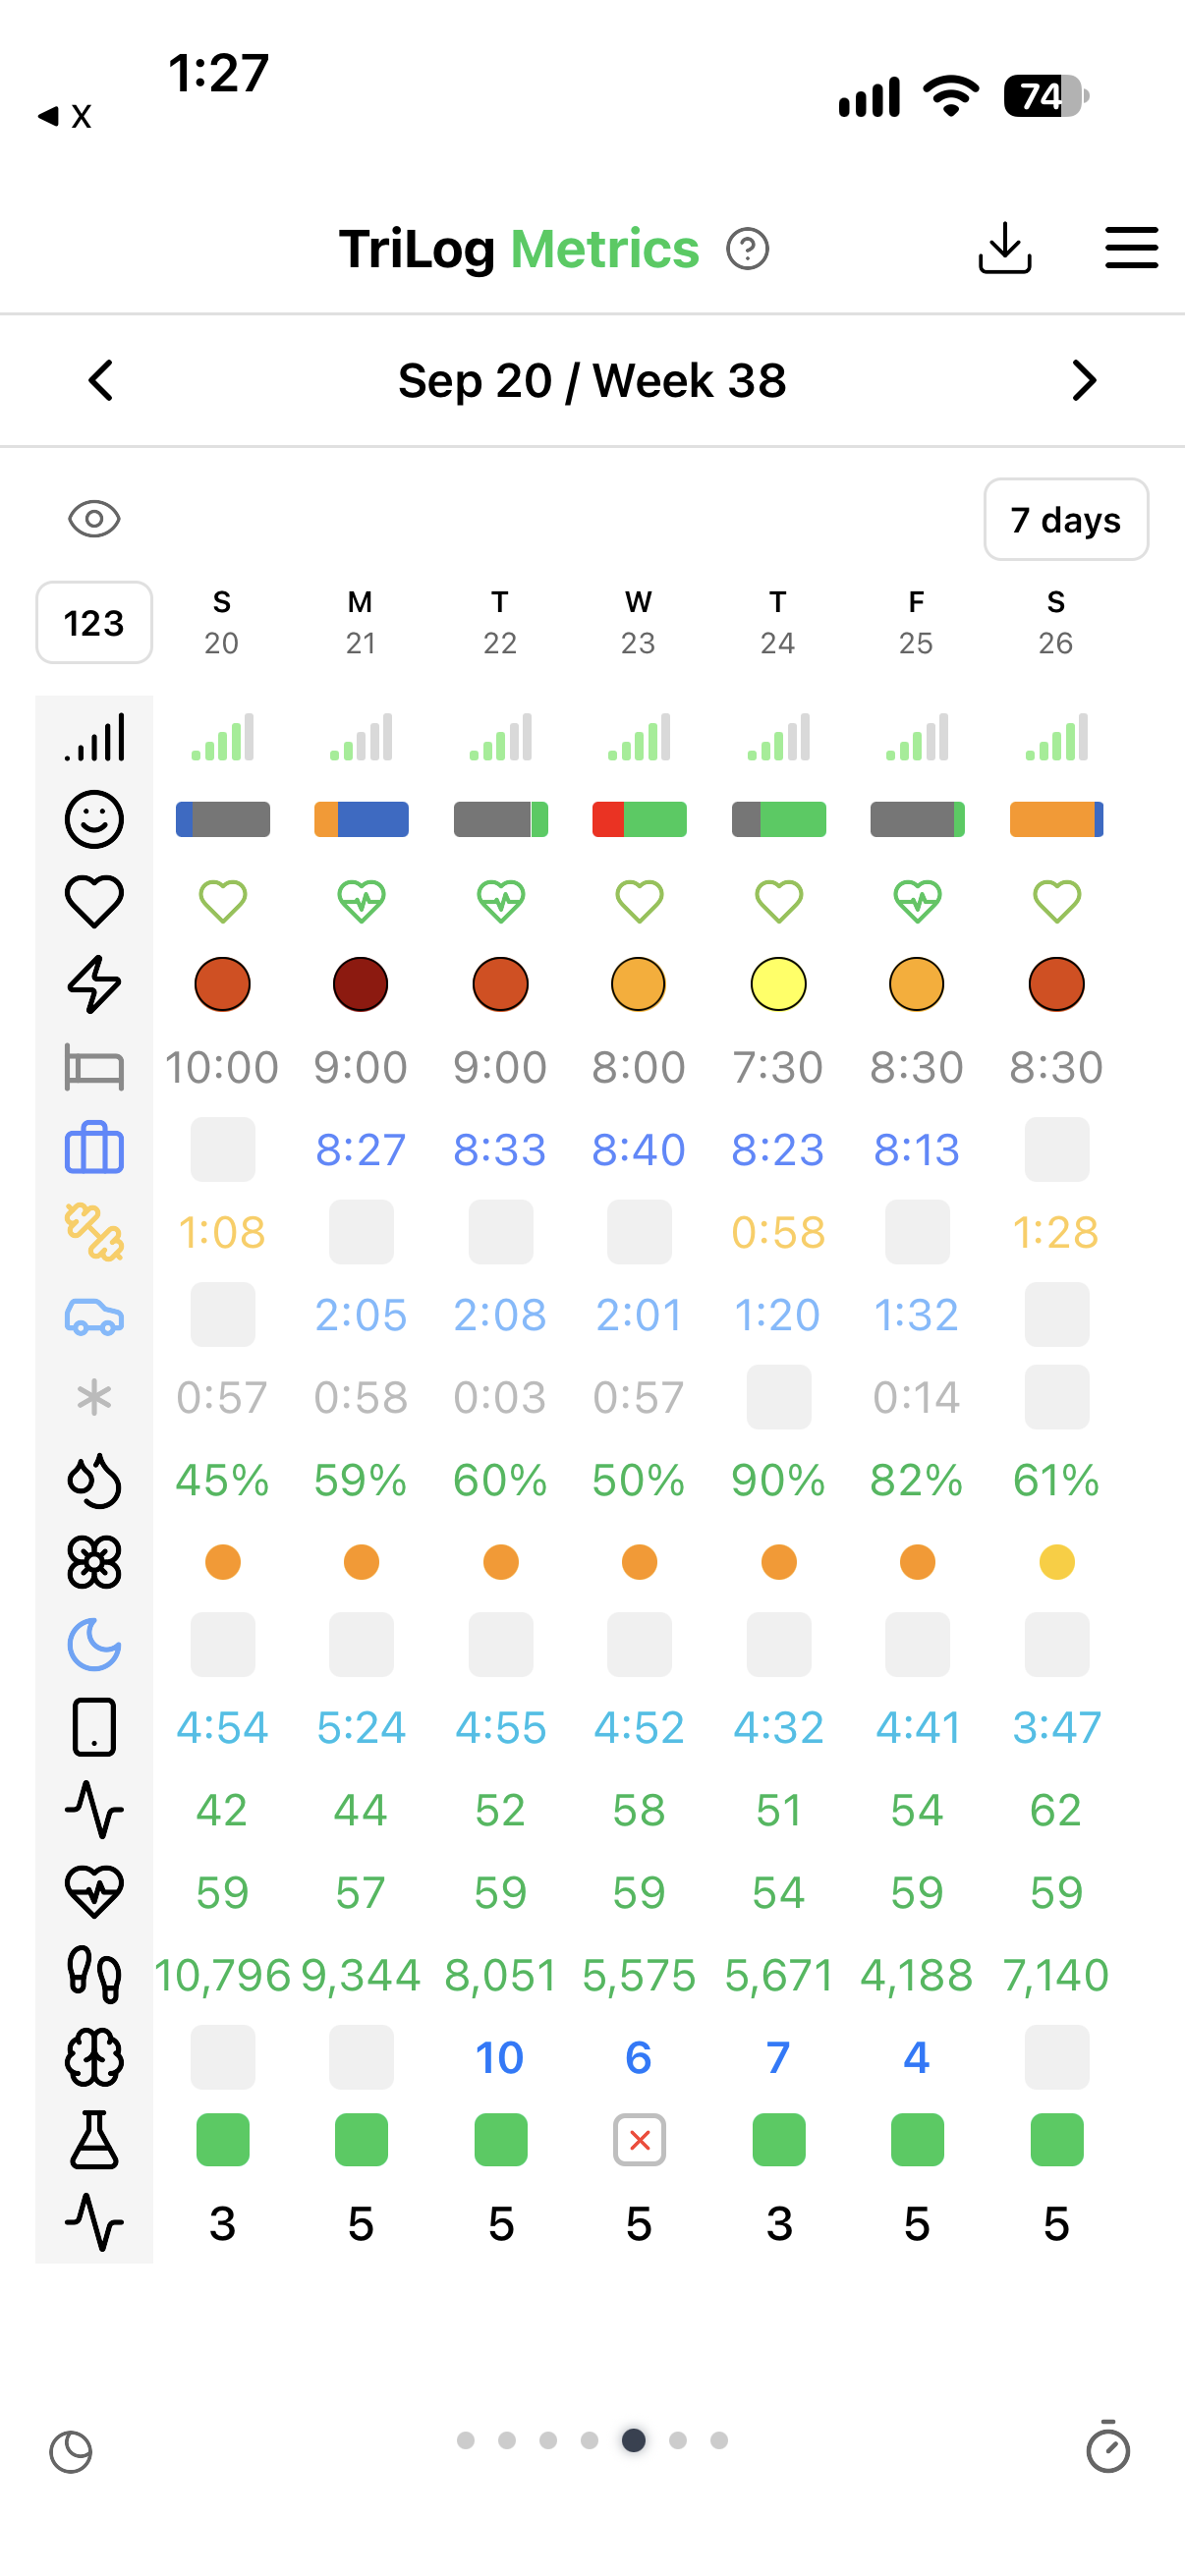
- A grid of daily values — sleep, energy, weather, steps, your day trackers and trials — one column per day.
- Journal
- Your journal notes and Day End reflections as a running day-by-day journal, with photos. Exportable.
- Analysis
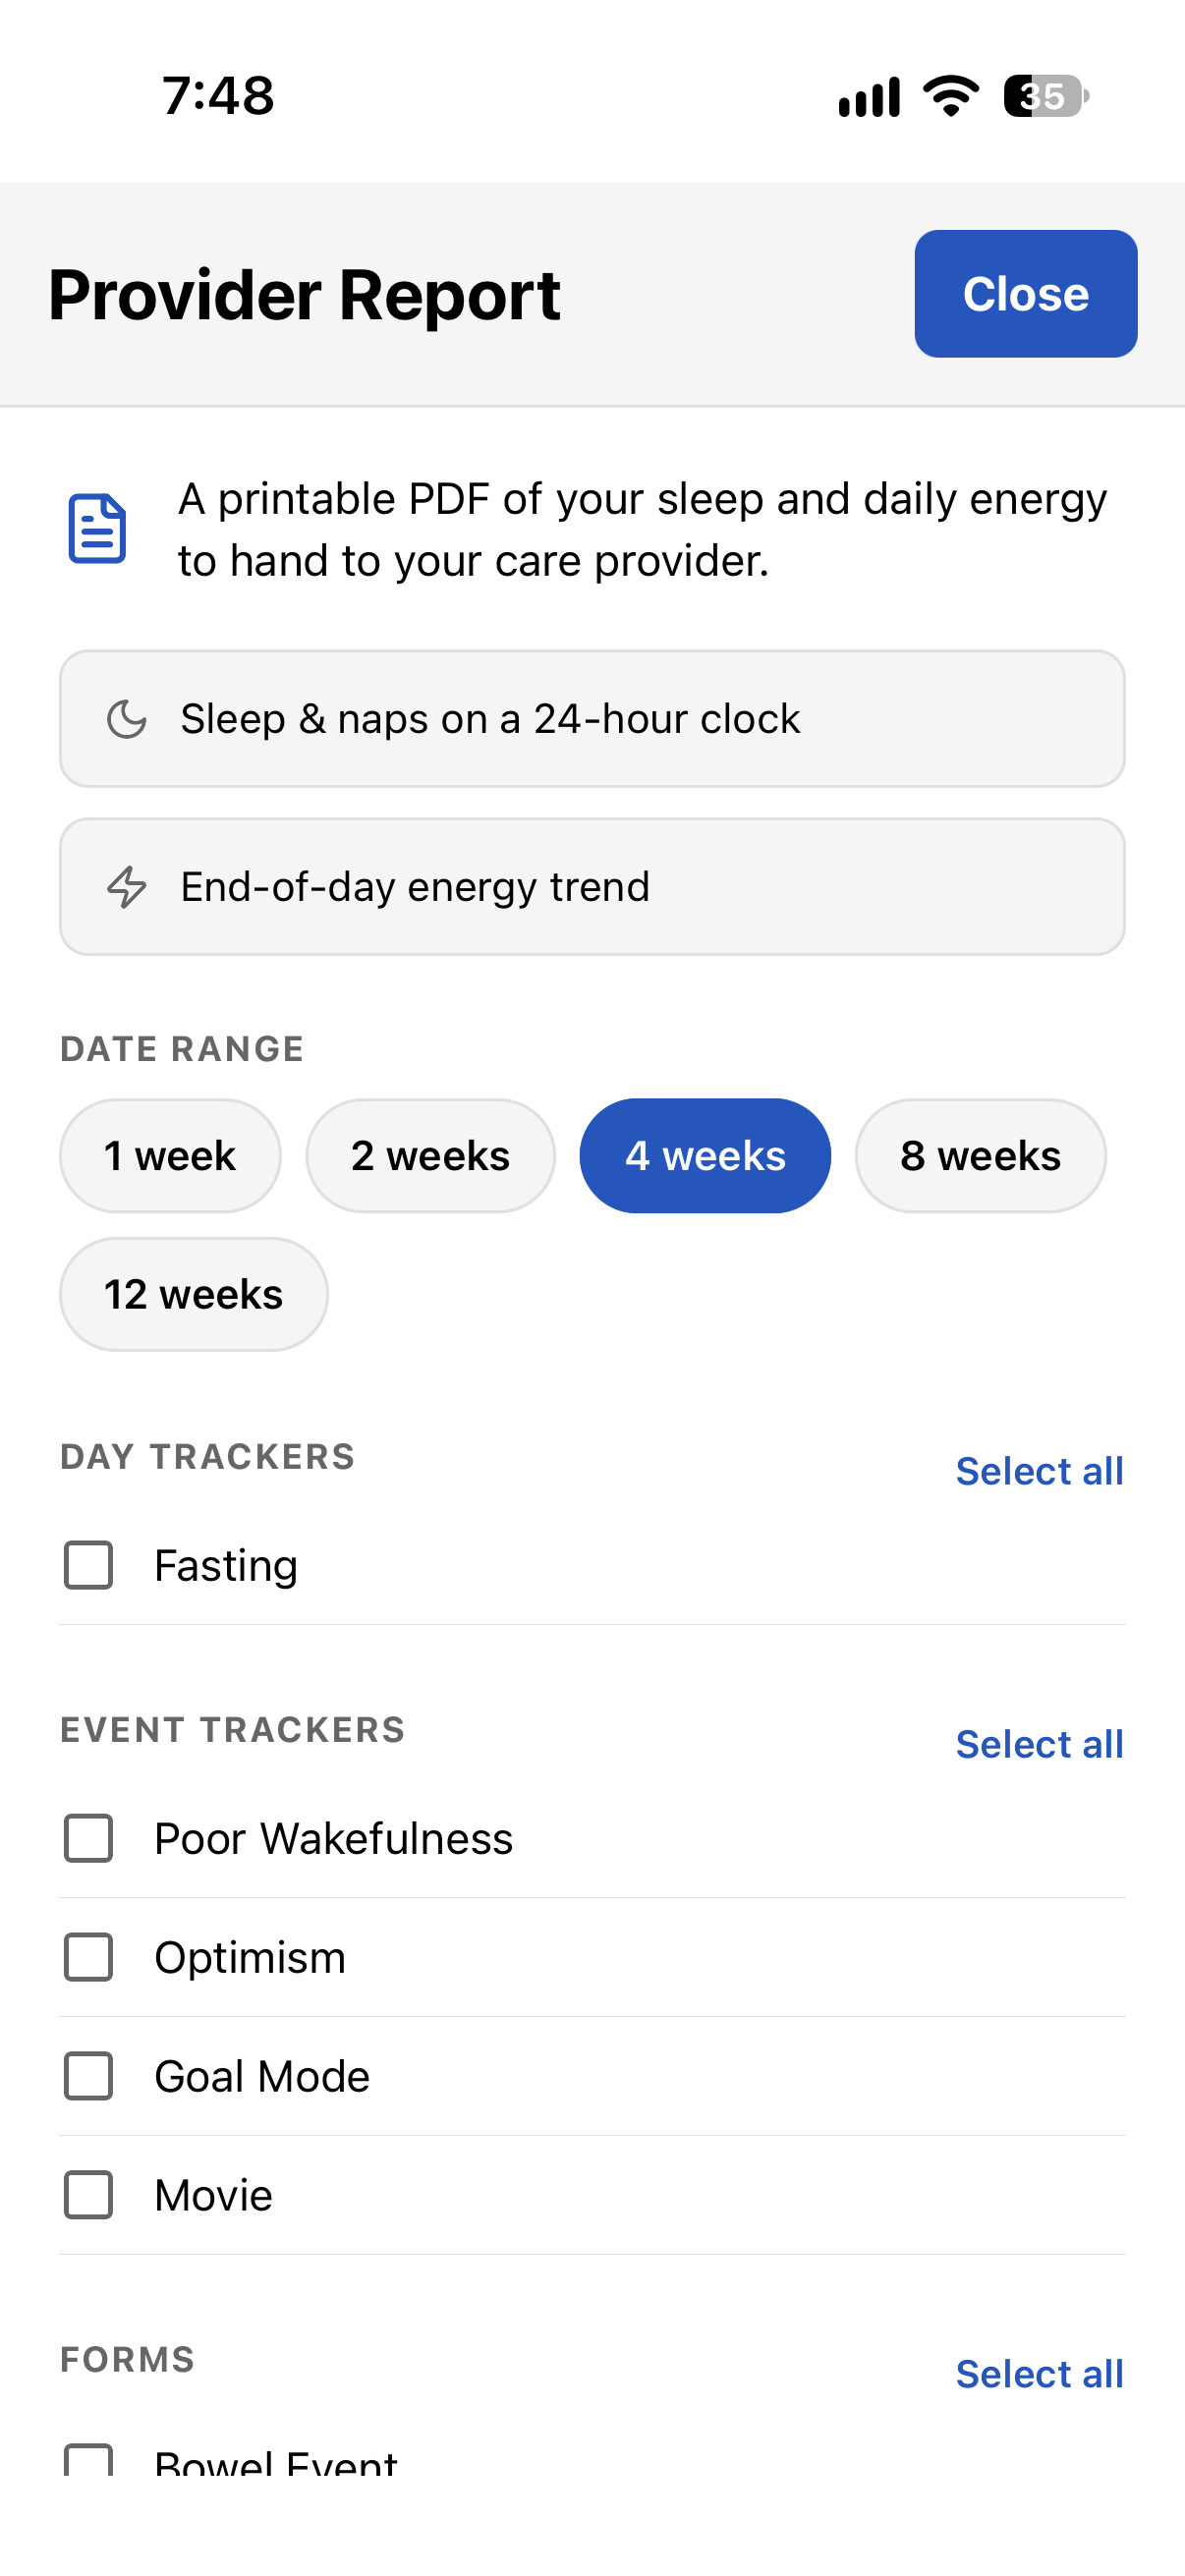
- Charts and reports over time: patterns, day ratings, correlations, intake and cycles against your ratings, and a printable sleep & energy summary to bring to an appointment.
- Interactive dashboard
- Export your metrics as a self-contained web page you can open on any computer: pick a date range, compare daily values with 7-day trends, explore how two measures move together (same day or the next), and see weekday patterns and period-to-period comparisons. Also available as an Excel spreadsheet.
- Desktop viewer
- A free, open-source app that lays out months — or a year — of your data on a big screen.
04Your data
Your log lives on your phone, optionally backed up to your own iCloud. There’s no account and no server holding your entries. You can export everything, in several formats, at any time.
TriLog is a logging tool, not a medical device. It records and displays; it doesn’t diagnose or interpret.
05Cost
Free for 30 days. After that, $59.99 a year or $7.99 a month to keep logging. Without a subscription the app becomes read-only: everything you logged stays browsable and exportable.
console.log for mental states
low friction input
dense visualization
Personal Data Logging with Analytics
Detailed Walk Through · Support · Privacy · Terms
TriLog® is a registered trademark of Joseph Orr.