Mac Companion

TriLog Viewer

A native macOS app that opens an export from your iPhone and lays it out for a desktop screen. Mood, energy, activity, weather, habits, trackers — all in one wide grid.

v1.1.2 Mac · Windows macOS 11+ · Windows 10+ Free · Open source

Windows users: the installer is not yet code-signed, so Windows SmartScreen will show a warning on first launch. Click More infoRun anyway. We'll add a Windows code-signing certificate later.

No TriLog data yet? Download a sample journal (~2 MB) with 2 years of generated data — open it in the viewer to see every tab in action.

What you can see

Six-week Metrics grid

Sunday-anchored, week-by-week navigation. Every per-day metric the iPhone tracks — mood, energy, wellness, Thrive, weather, sleep, HK fields — laid out as one wide grid. Row visibility mirrors your iPhone settings.

Mood Chart

The iPhone's punch-card chart, redrawn for the wider screen. Optional cycle, weather, and moon-phase strips. Hover any element for time + type + notes.

Habits

Your daily checkboxes as a 42-day grid. Spot streaks and gaps at a glance.

Custom Trackers

Every tracker type rendered the same as on the iPhone: numeric chips, traffic-light squares, toggle states, itemized counts. The data lines up exactly so you can cross-reference.

Life Calendar

Optional 100-year × 52-week grid filled in week by week. Set a focus horizon to highlight the years you care most about.

Keyboard-friendly

Native Mac app, not a web view in a wrapper. Real menu bar, real keyboard shortcuts, no Electron tax.

How to use it

  1. Download and install the .dmg. Signed and notarized by Apple, so it opens cleanly the first time — no right-click-then-Open dance.
  2. Export a bundle from the iPhone app. In TriLog: Settings → Backup → Export Bundle (.zip). AirDrop the zip to your Mac and unzip it — you'll get a journal.db file plus an images/ folder.
  3. Open the viewer and click "Open Database…" Point it at the journal.db from the unzipped folder. The app loads it and switches to the Mood Chart tab.
  4. Browse. Tabs along the top — Mood Chart, Metrics, Habits, Trackers, Life Calendar. Settings menu (top-right) toggles the optional strips and Life Calendar.

Screenshots

macOS dark mode shown. Adapts to the system theme.
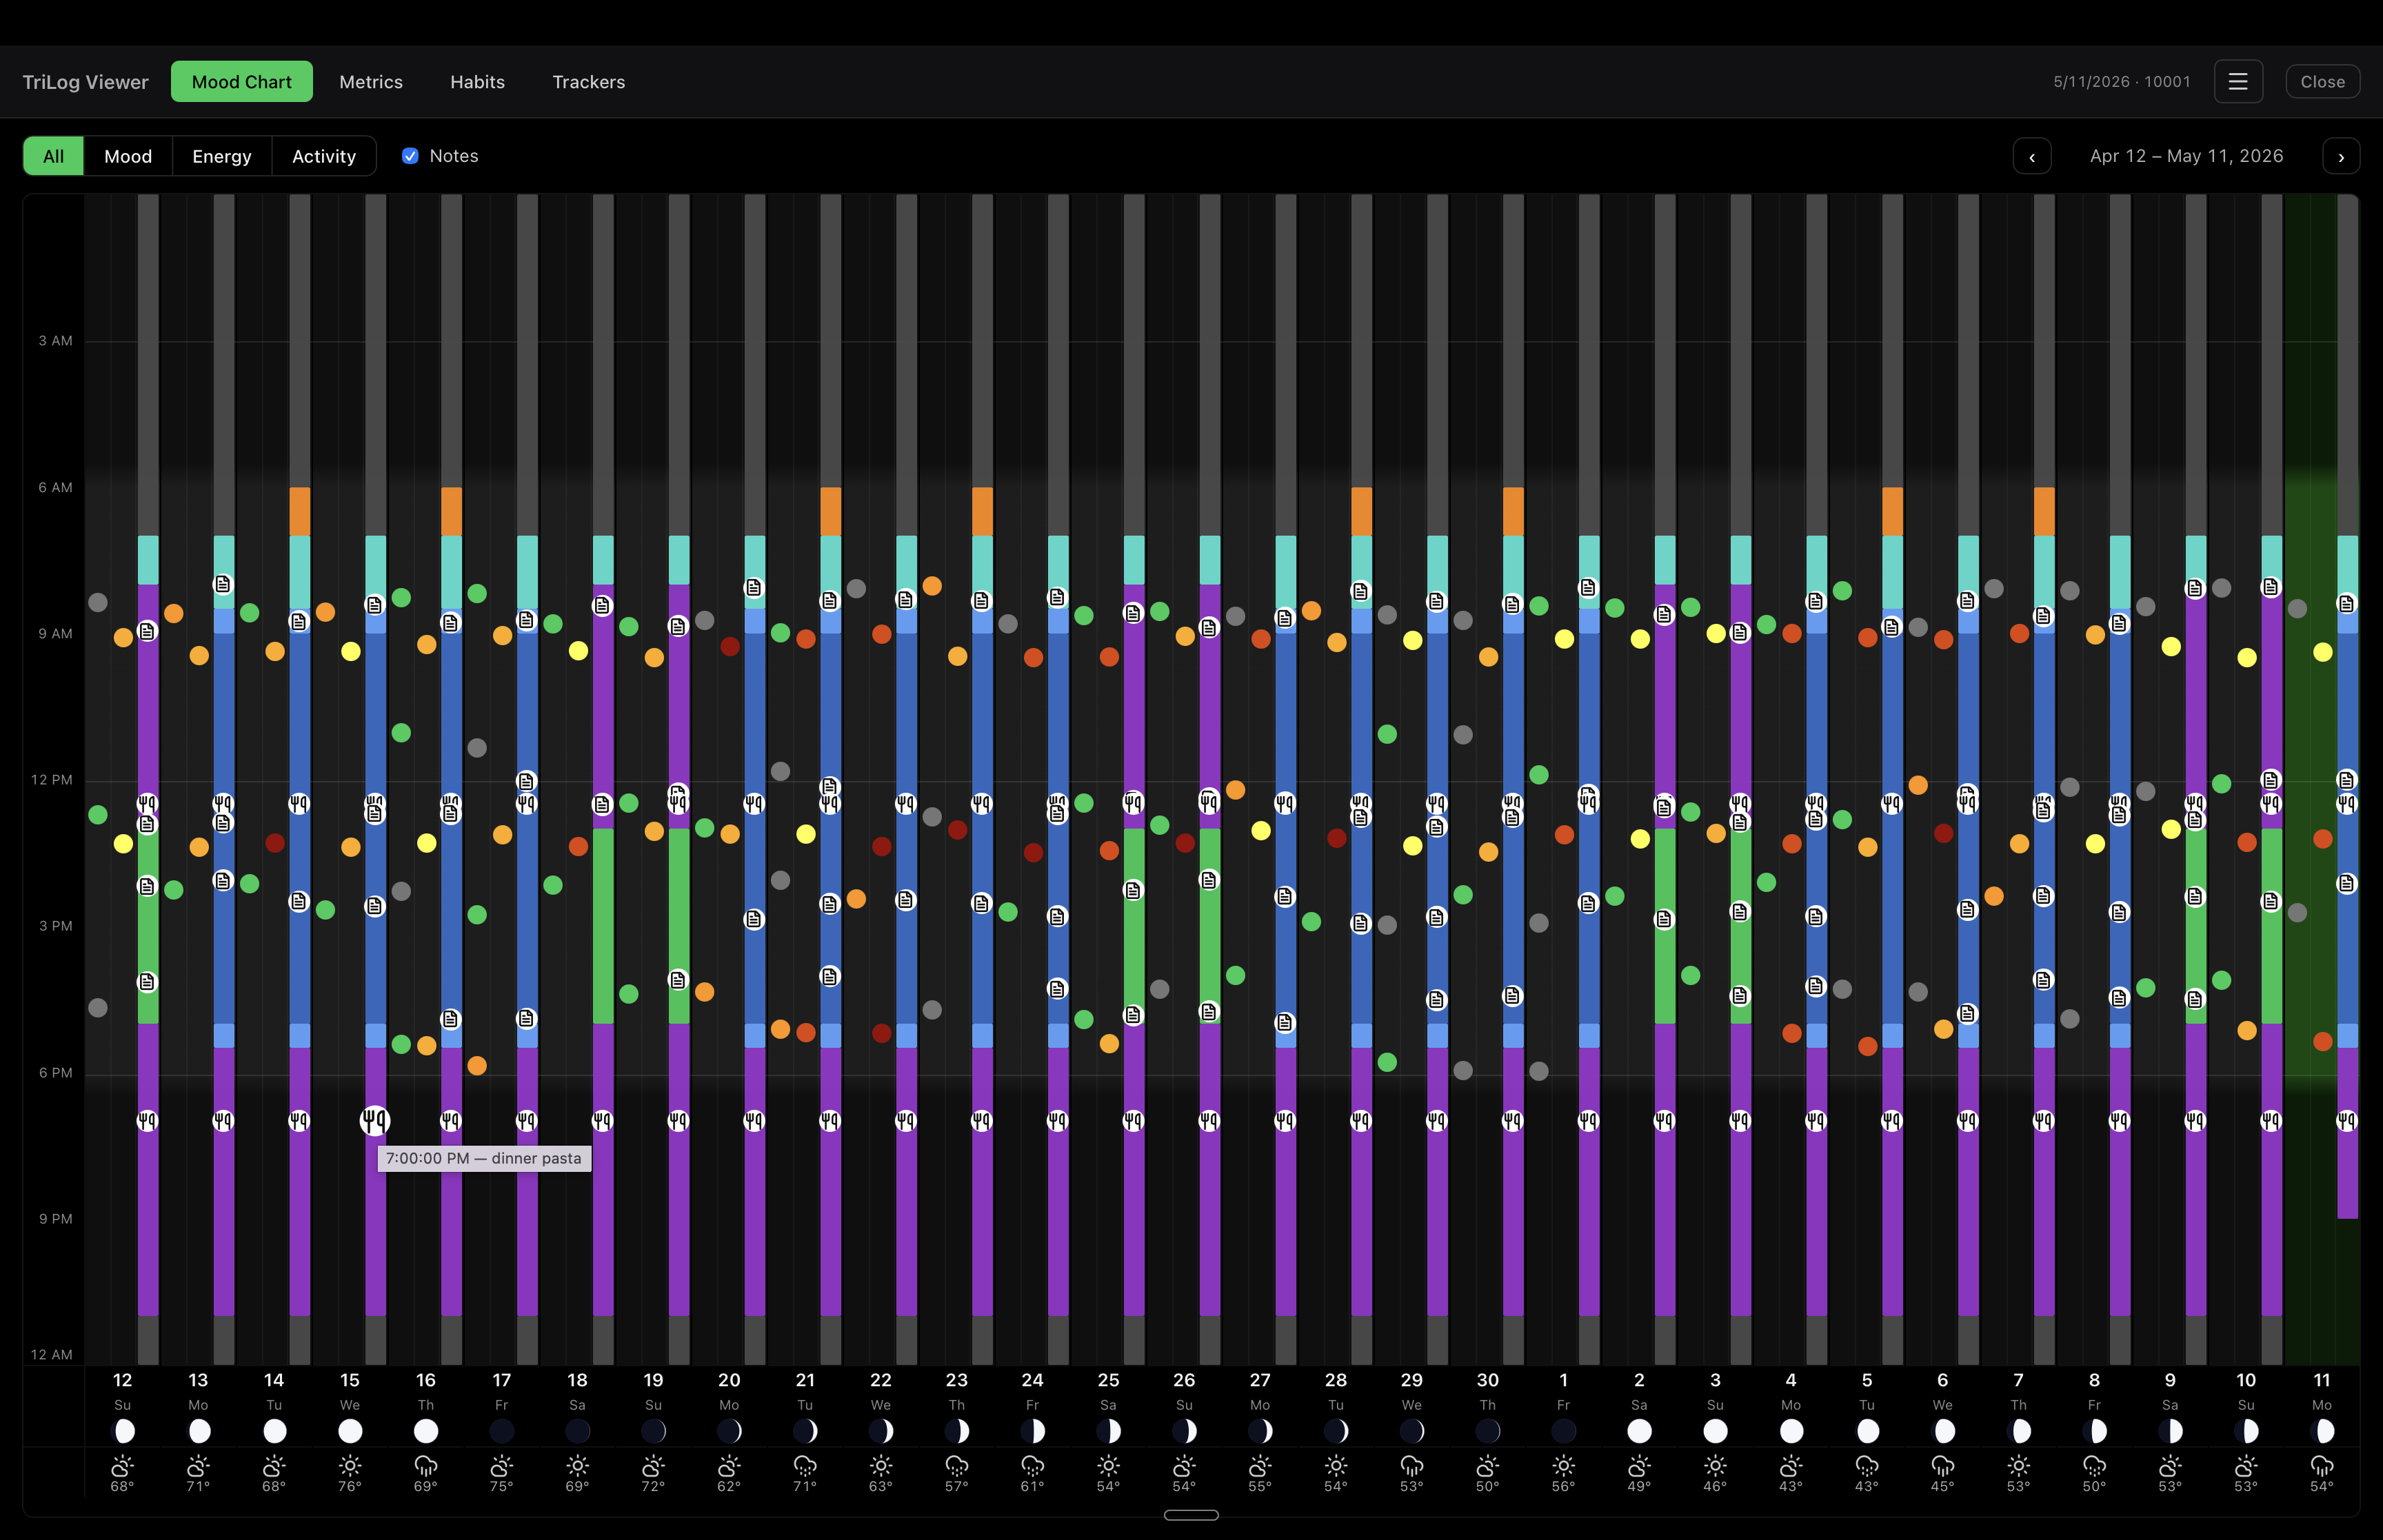
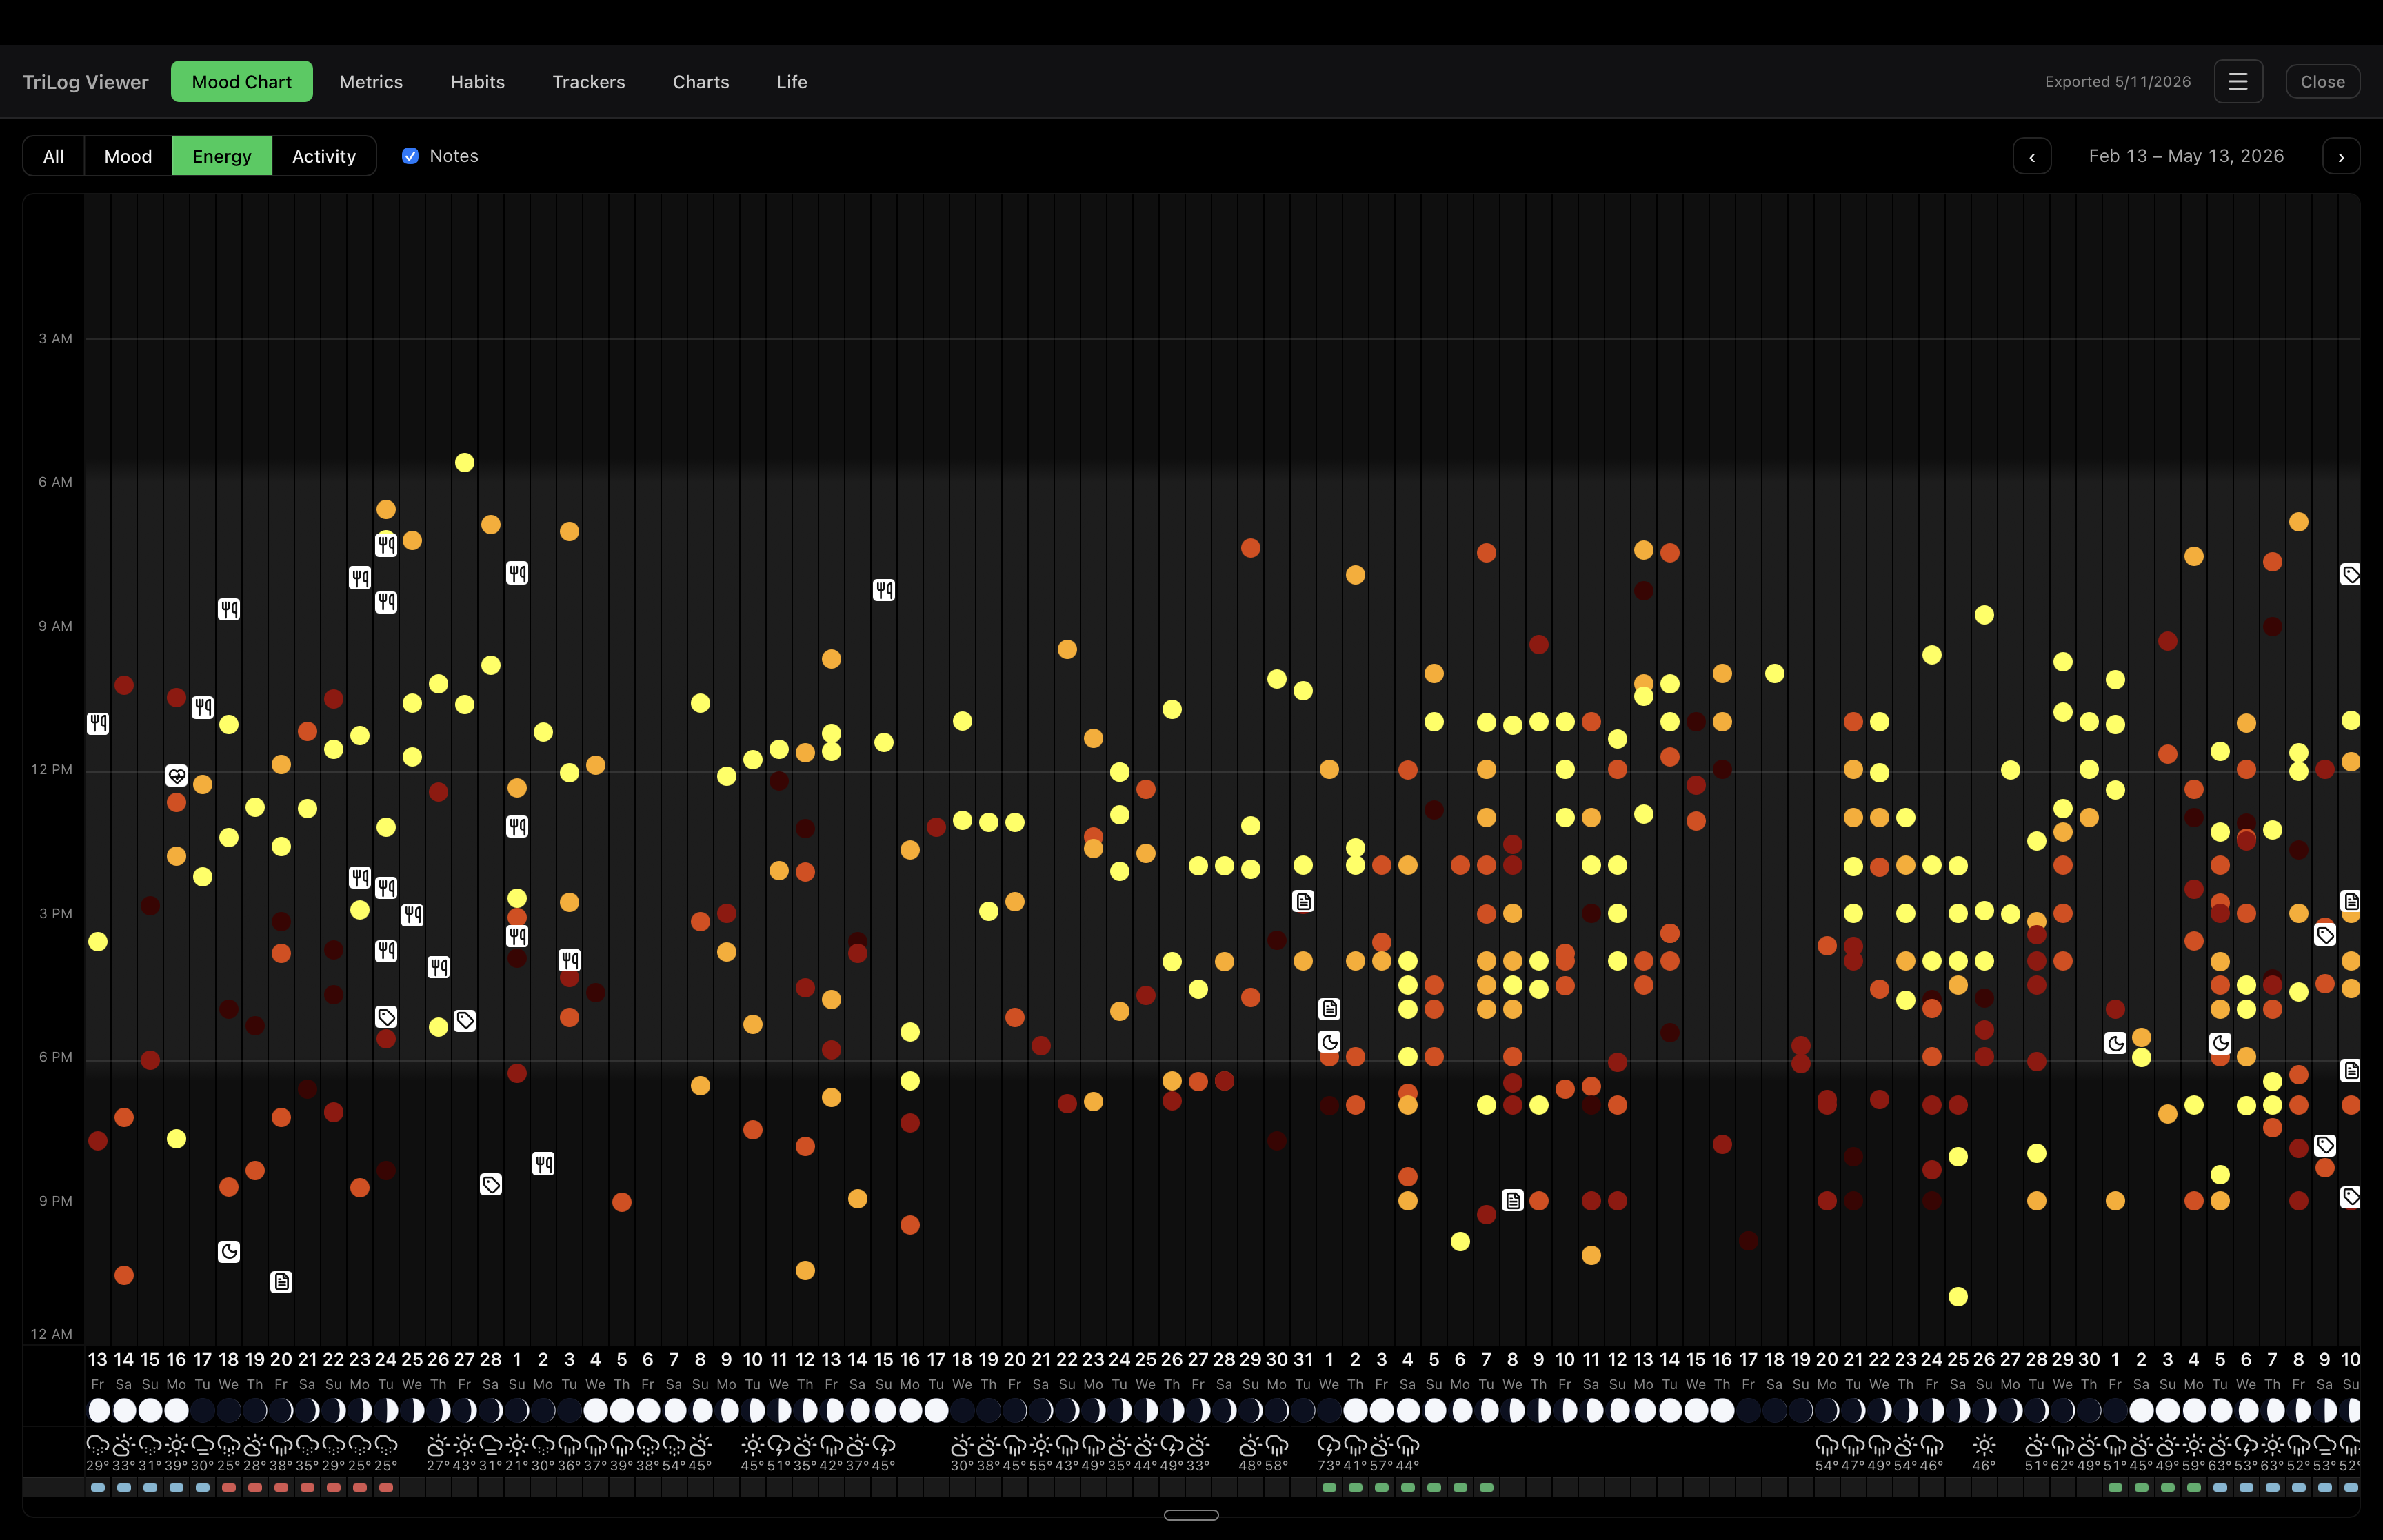
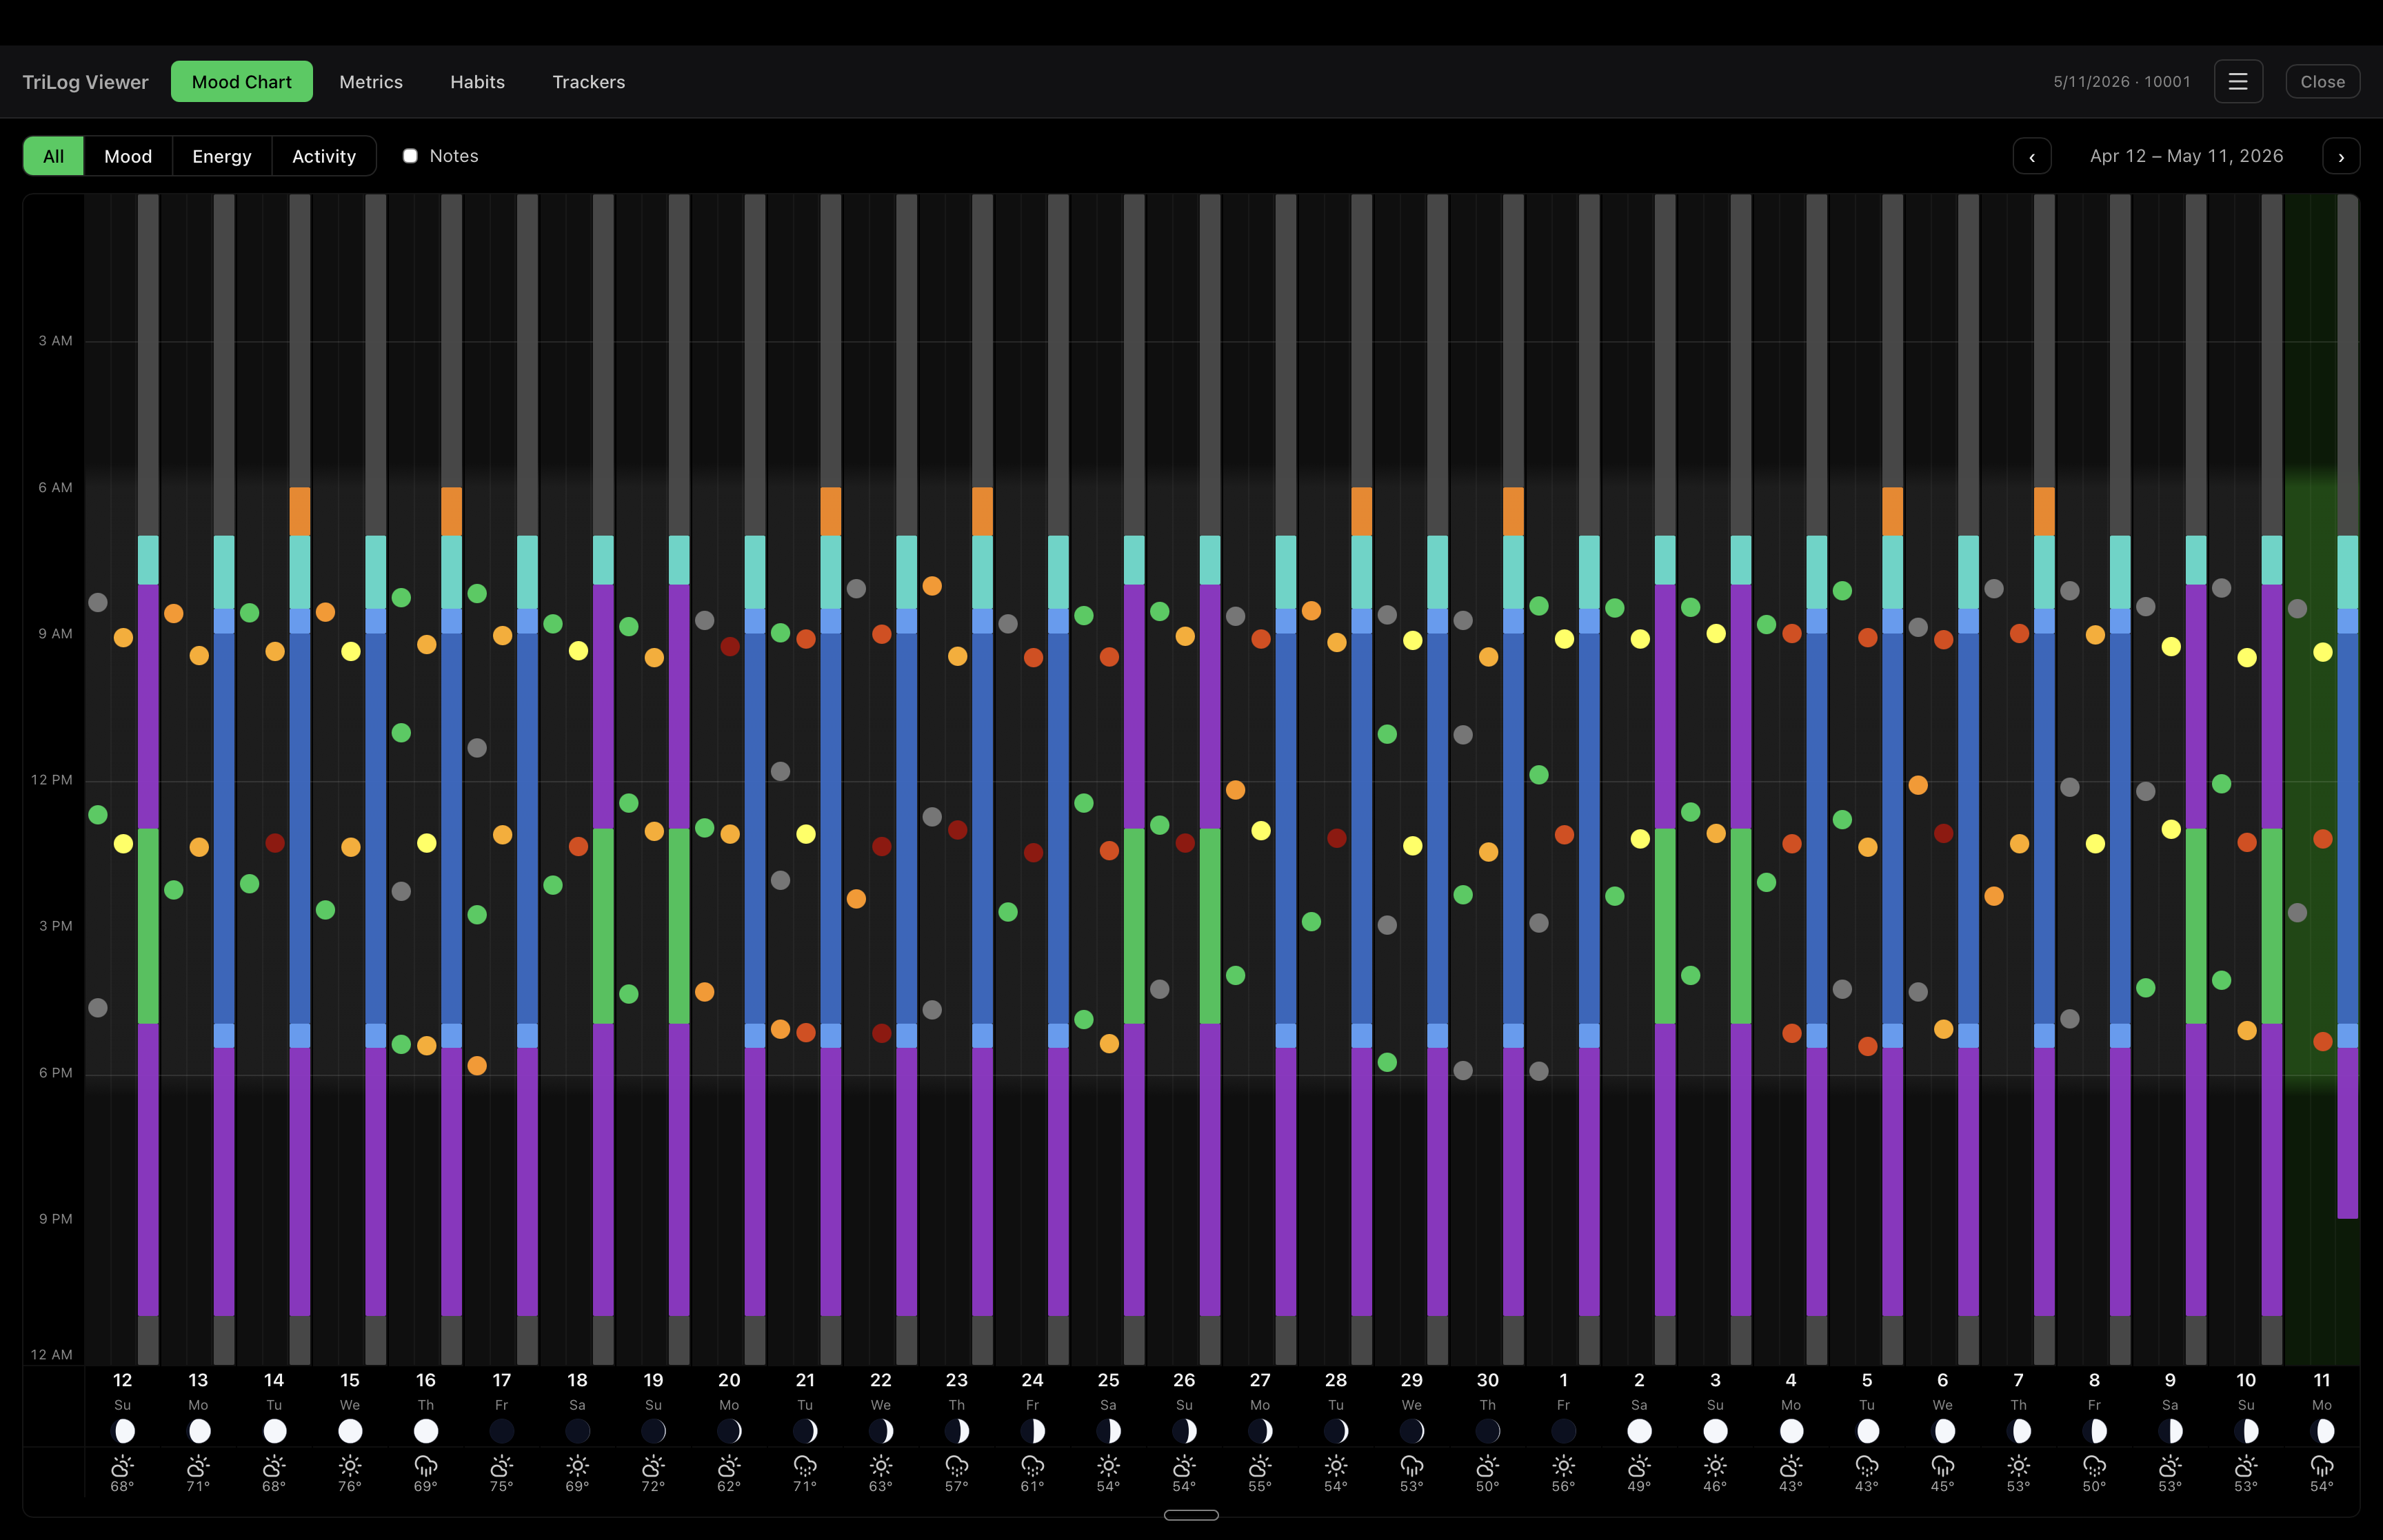
Mood Chart tab — punch-card view with mood, energy, activity dots and notes

Mood Chart

The iOS punch-card chart at desktop scale. Mood, energy, activity columns side by side, with moon phases and weather strips along the bottom.
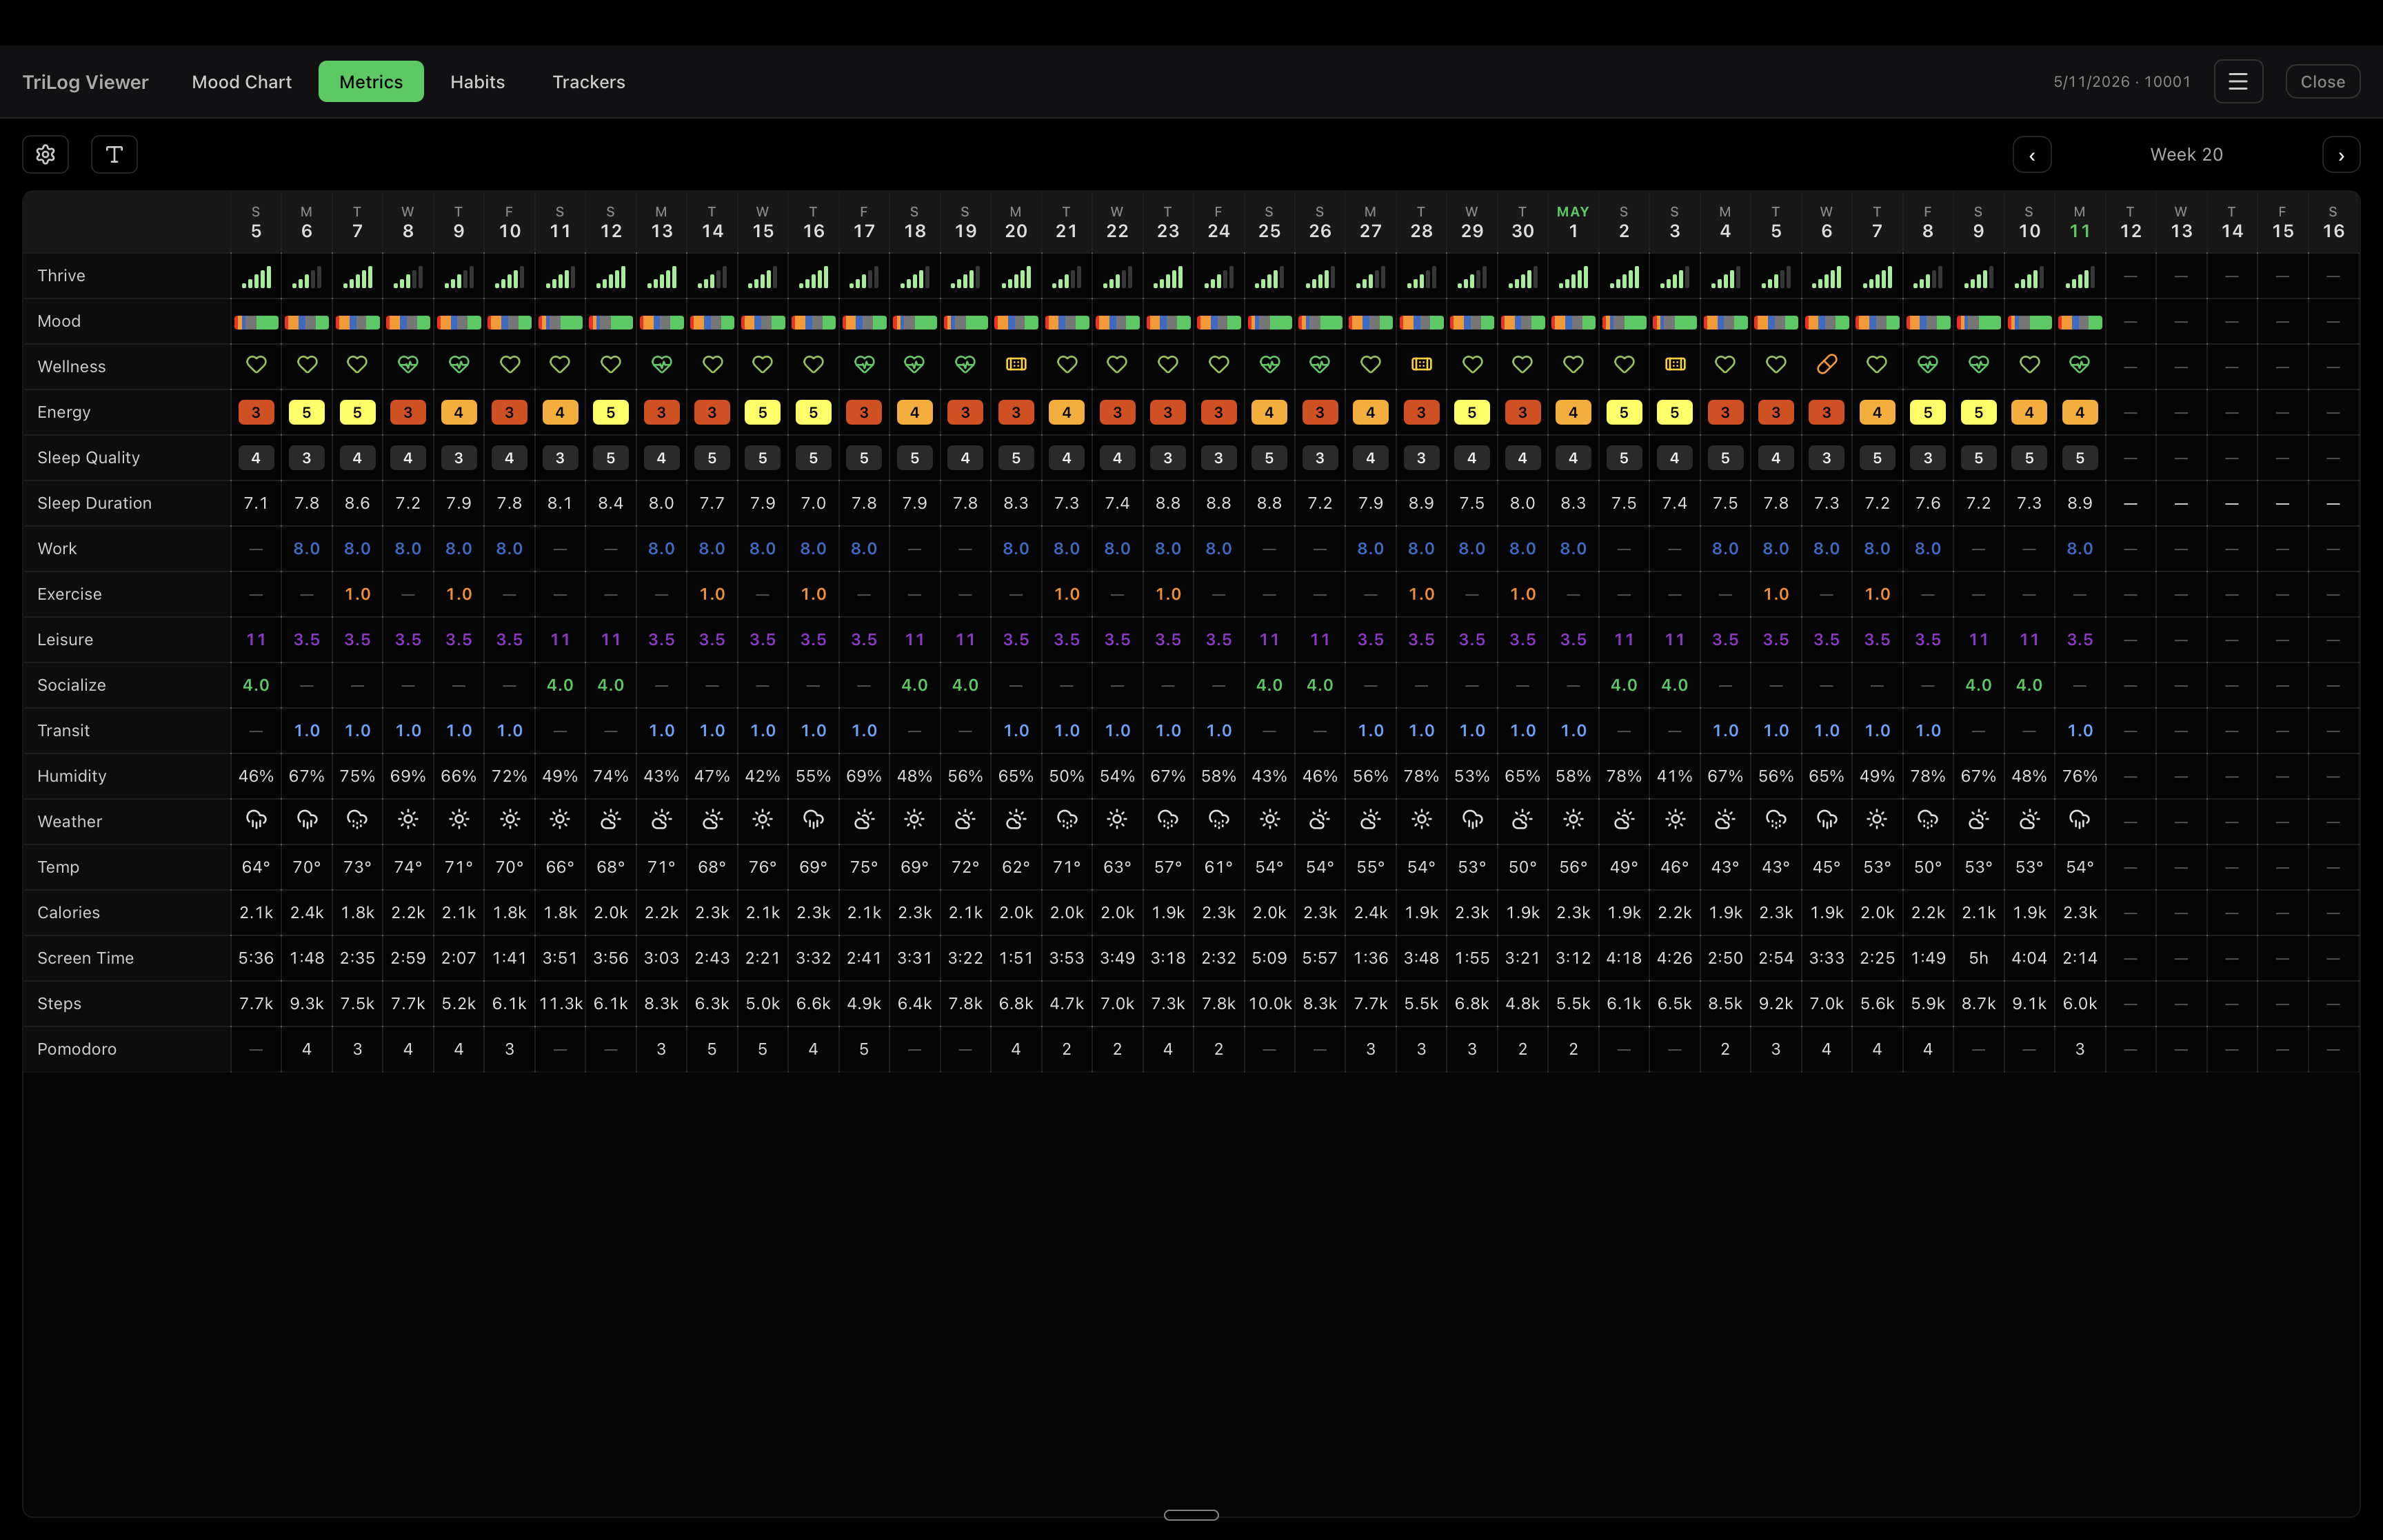
Metrics tab — per-day grid showing Thrive, Mood, Energy, Wellness, sleep, weather, activities

Metrics

Six weeks of every per-day metric the iPhone tracks. Sunday-anchored grid, week-by-week navigation, row order and visibility match your iPhone WeekView.
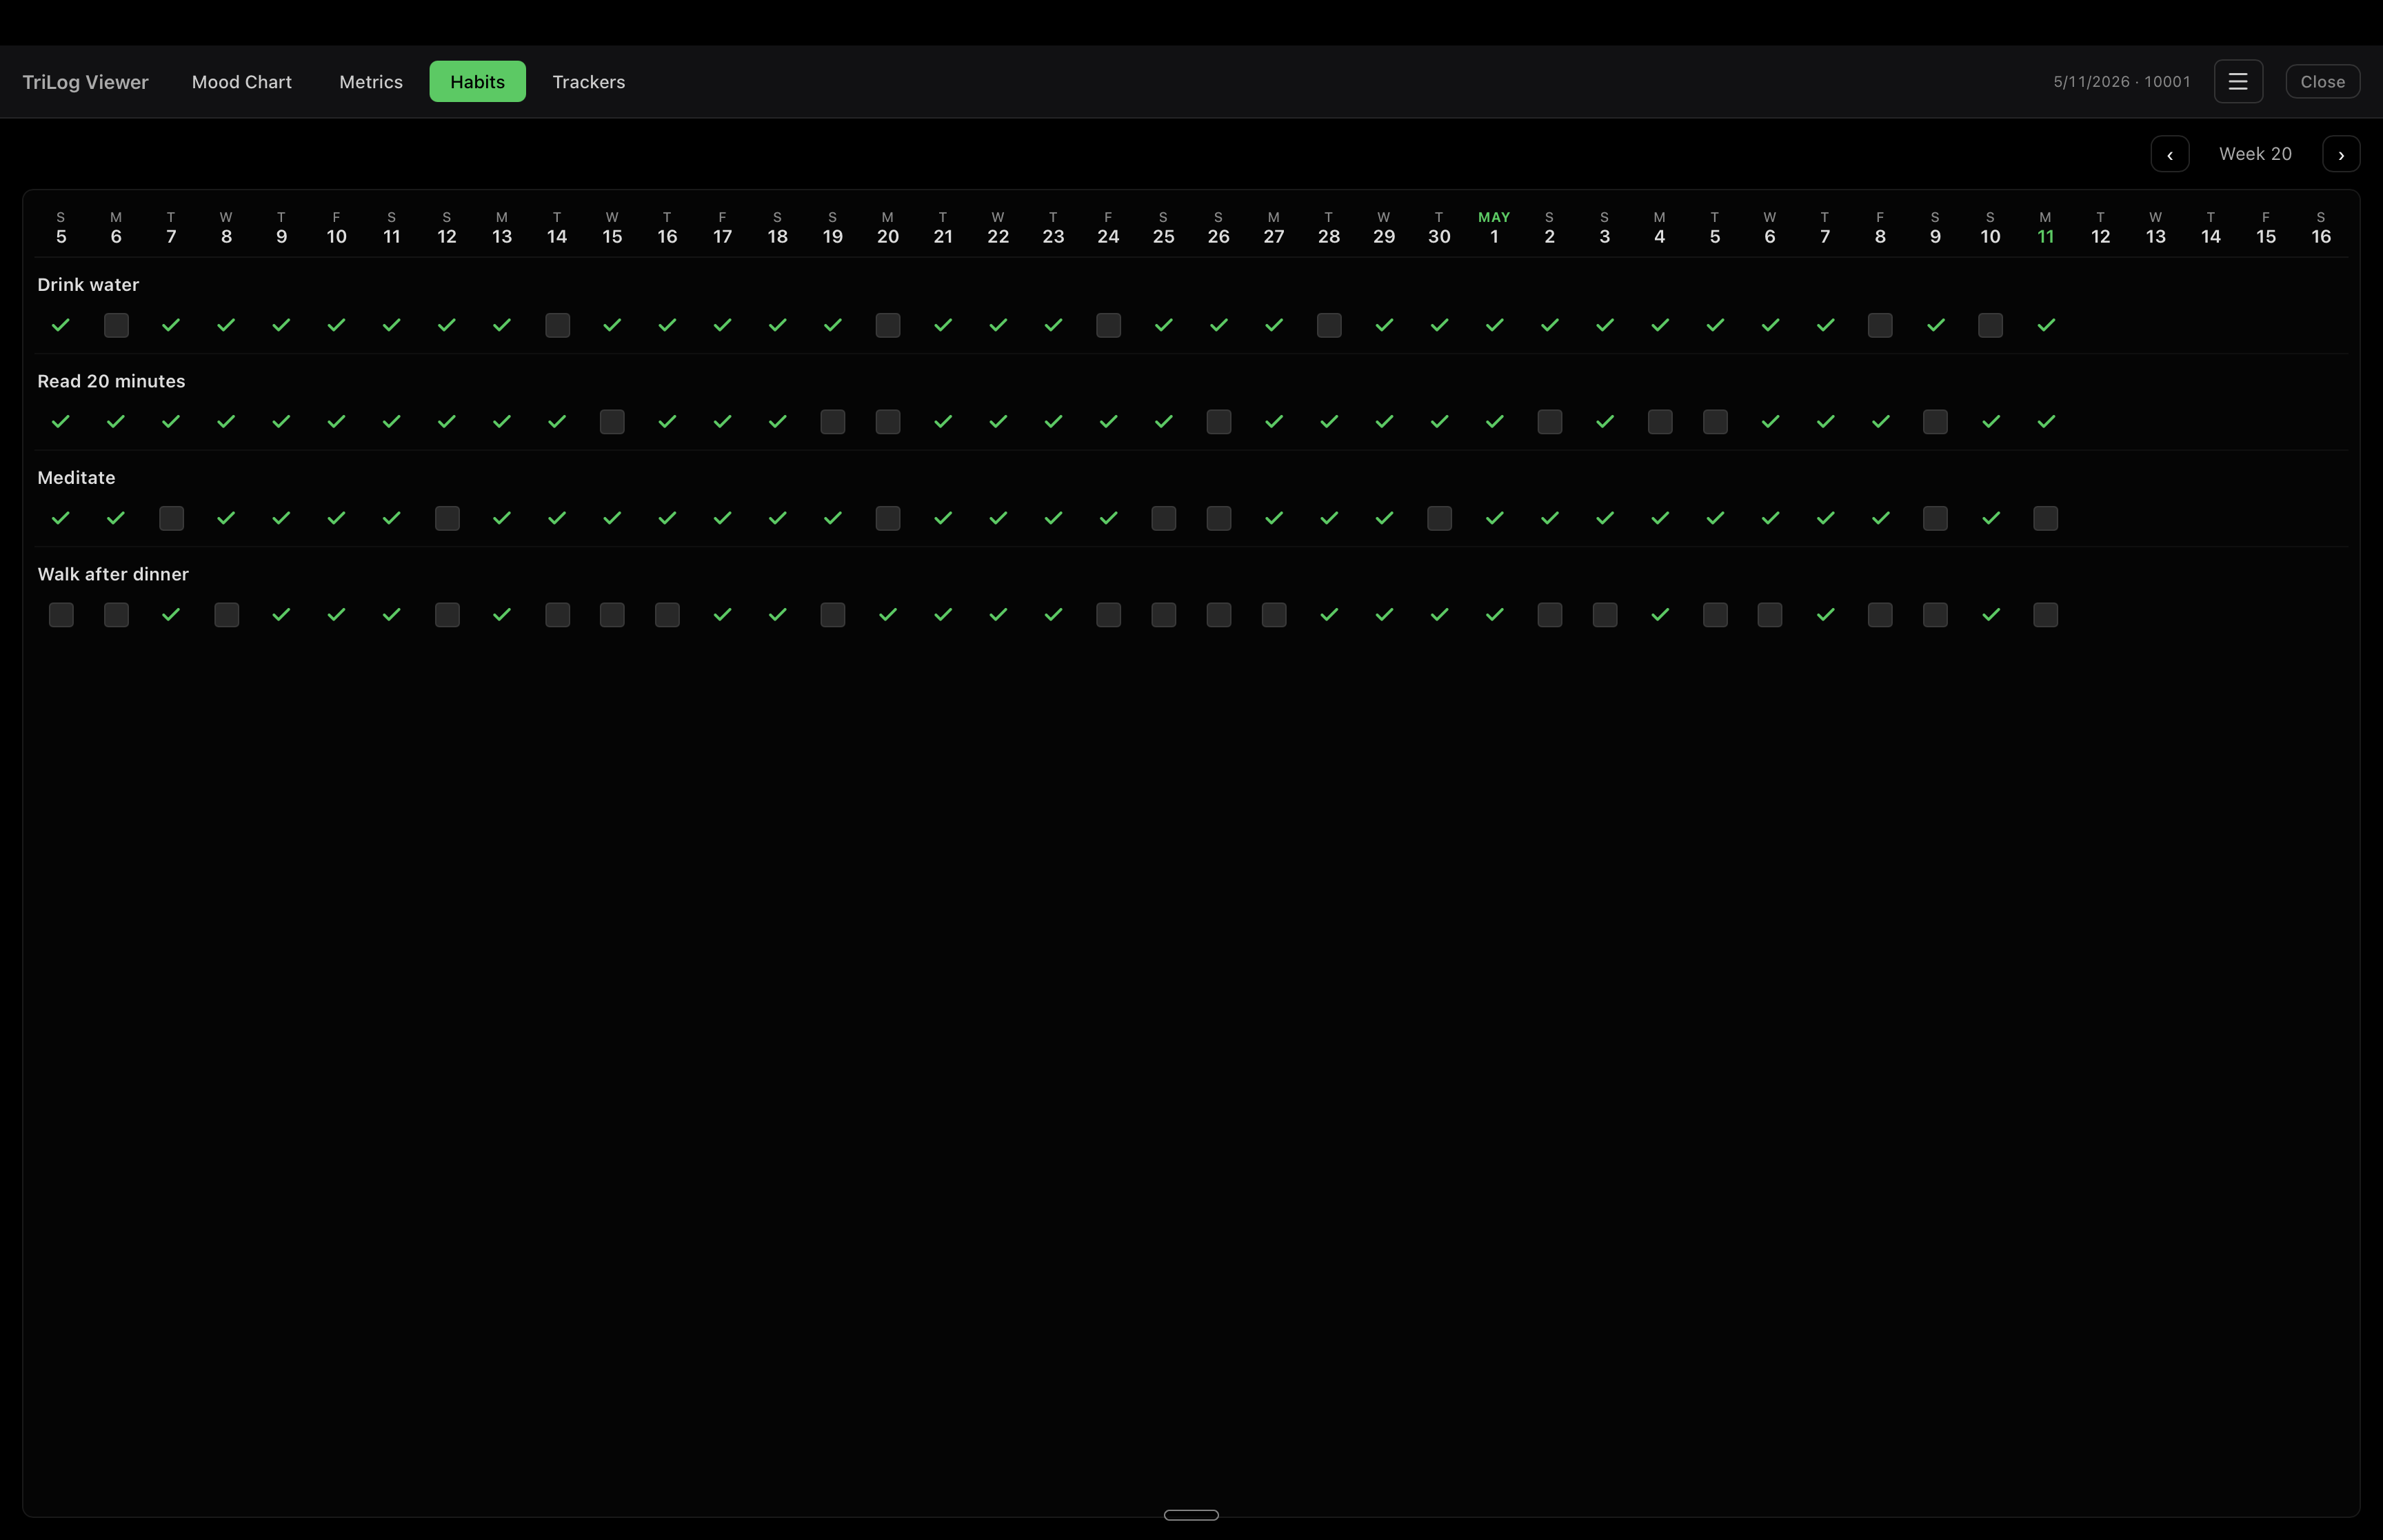
Habits tab — 42-day grid with green checkmarks for completed days

Habits

Each habit gets its own 42-day row. Green checks for completions, hollow squares for missed days, blank for the future.

Trackers tab — caffeine sums, brain-fog traffic-light squares, vegan toggle squares

Trackers

Every custom tracker rendered the same as on the iPhone. Sum chips, traffic-light squares, and toggle states all match — easy to cross-reference.

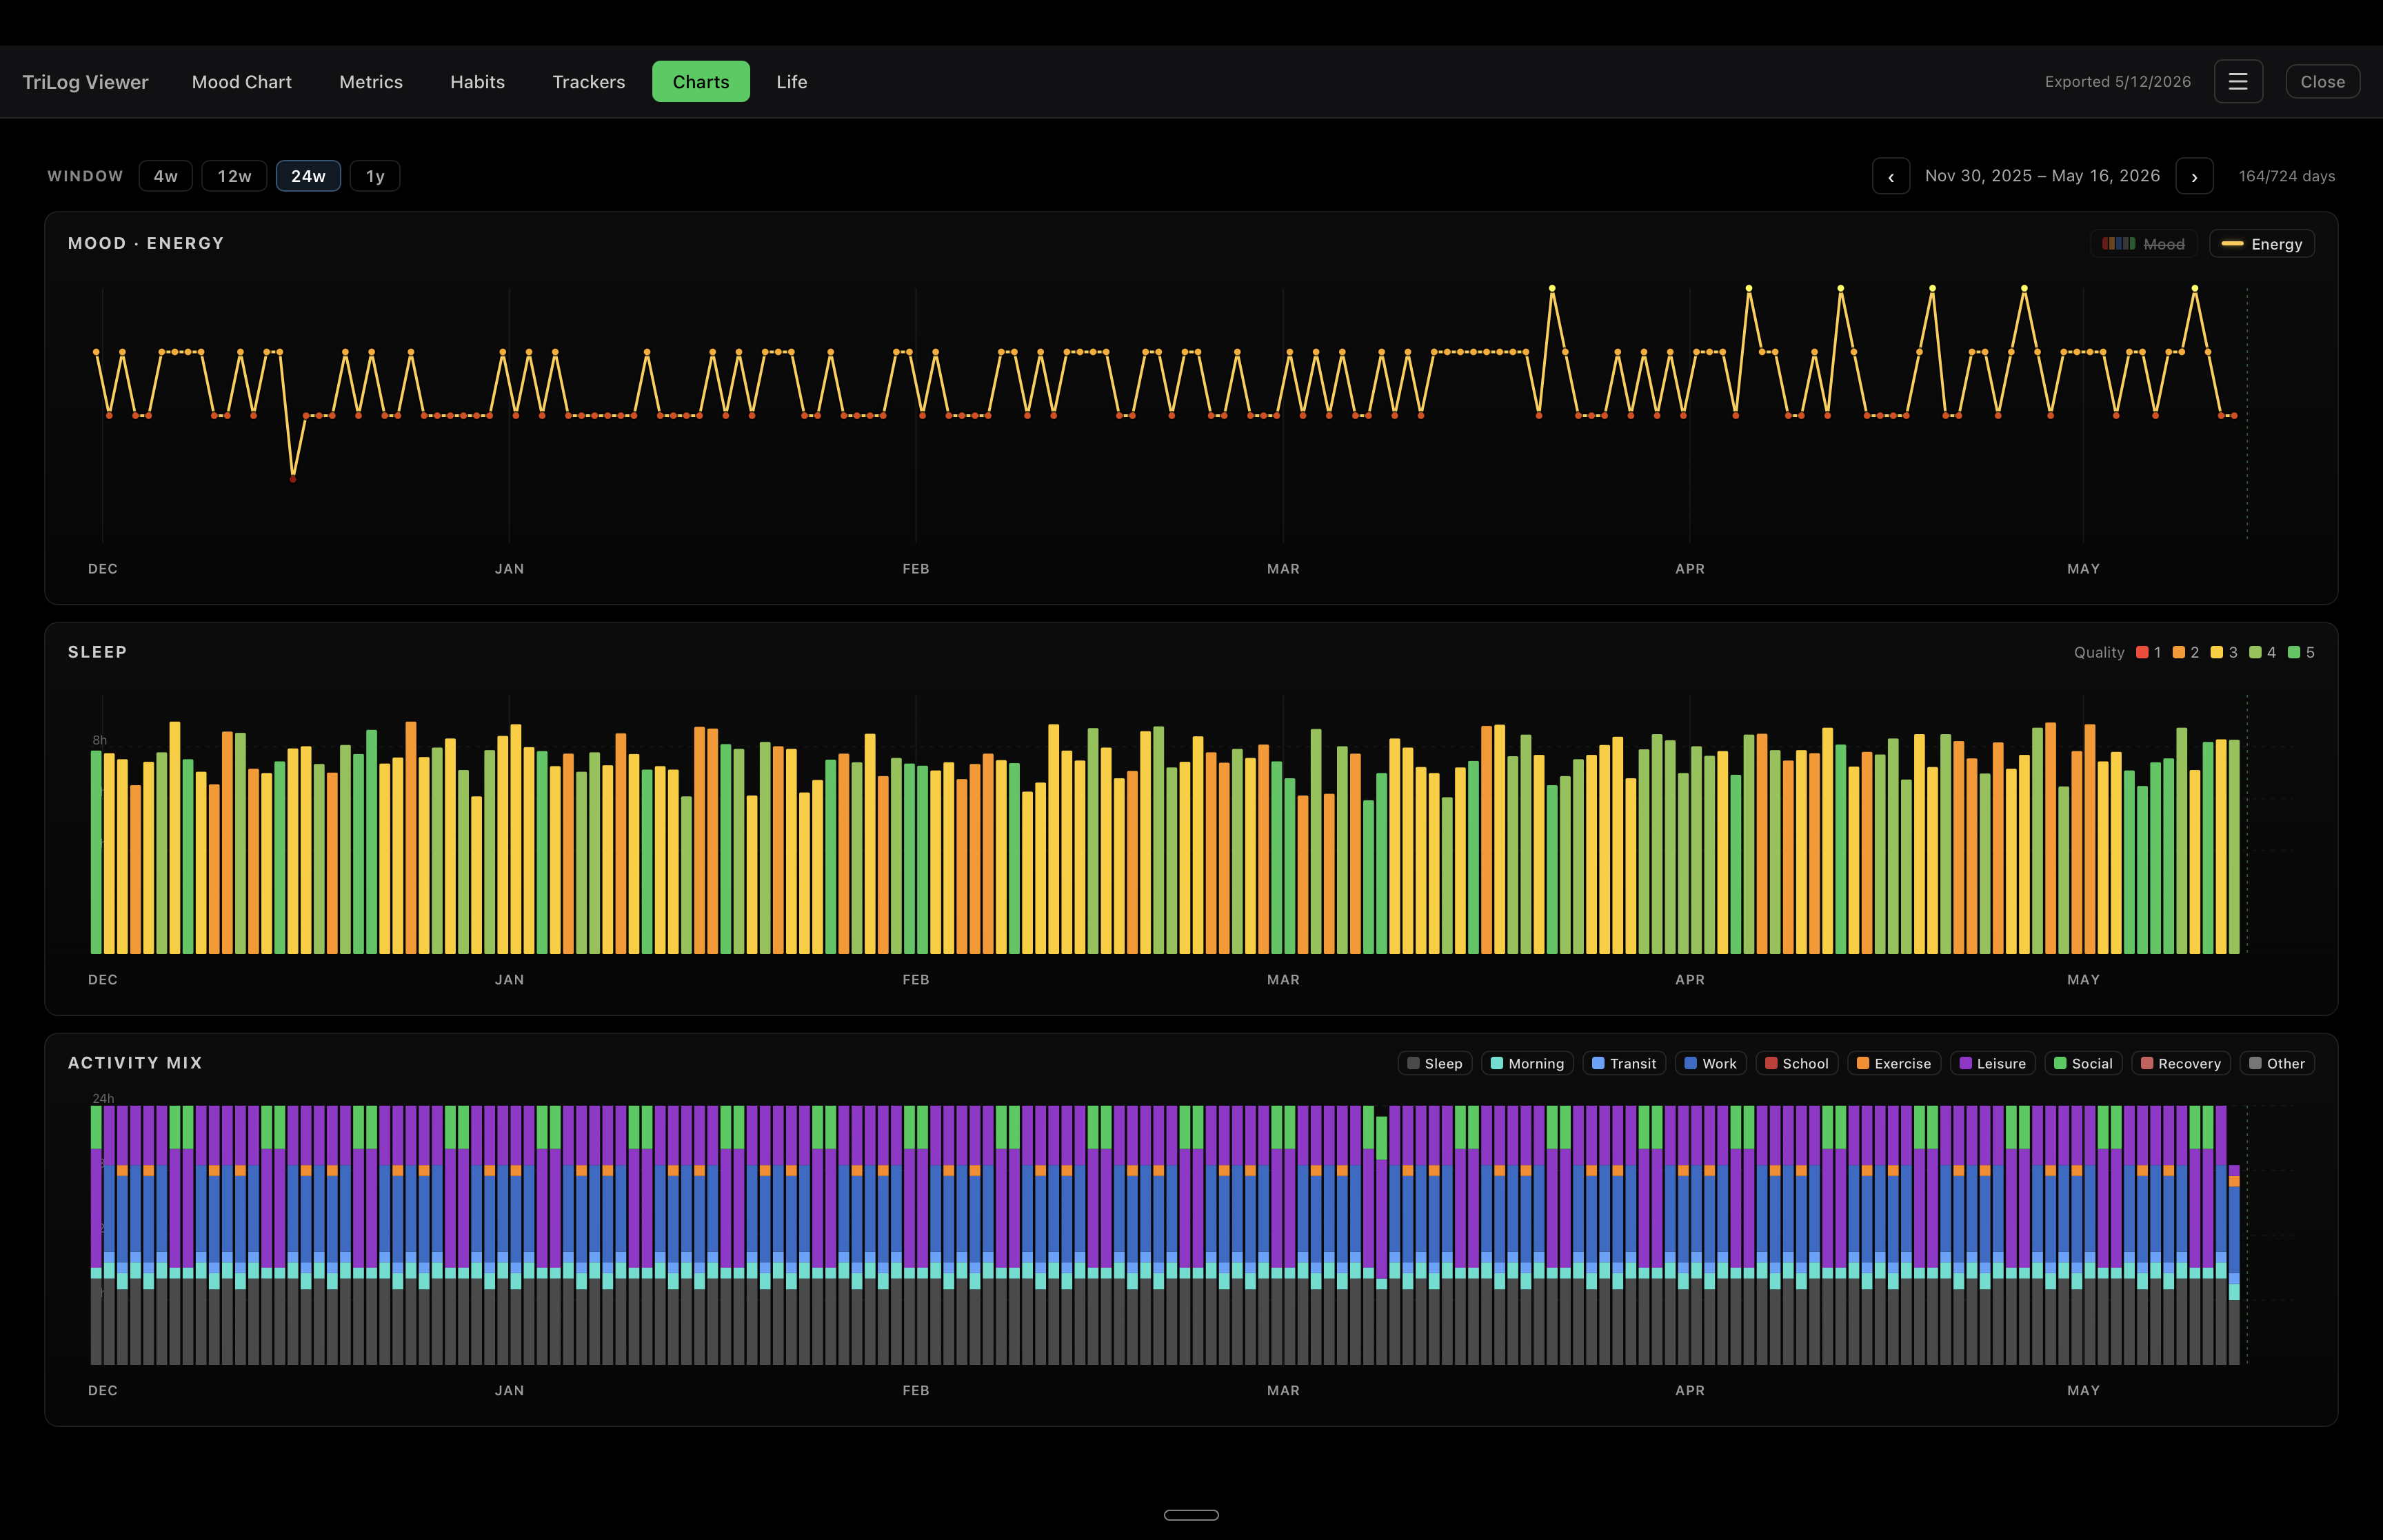
Charts — long-range trends

Charts tab at 12 weeks showing the mood-mix stacked bars with the yellow energy line overlay

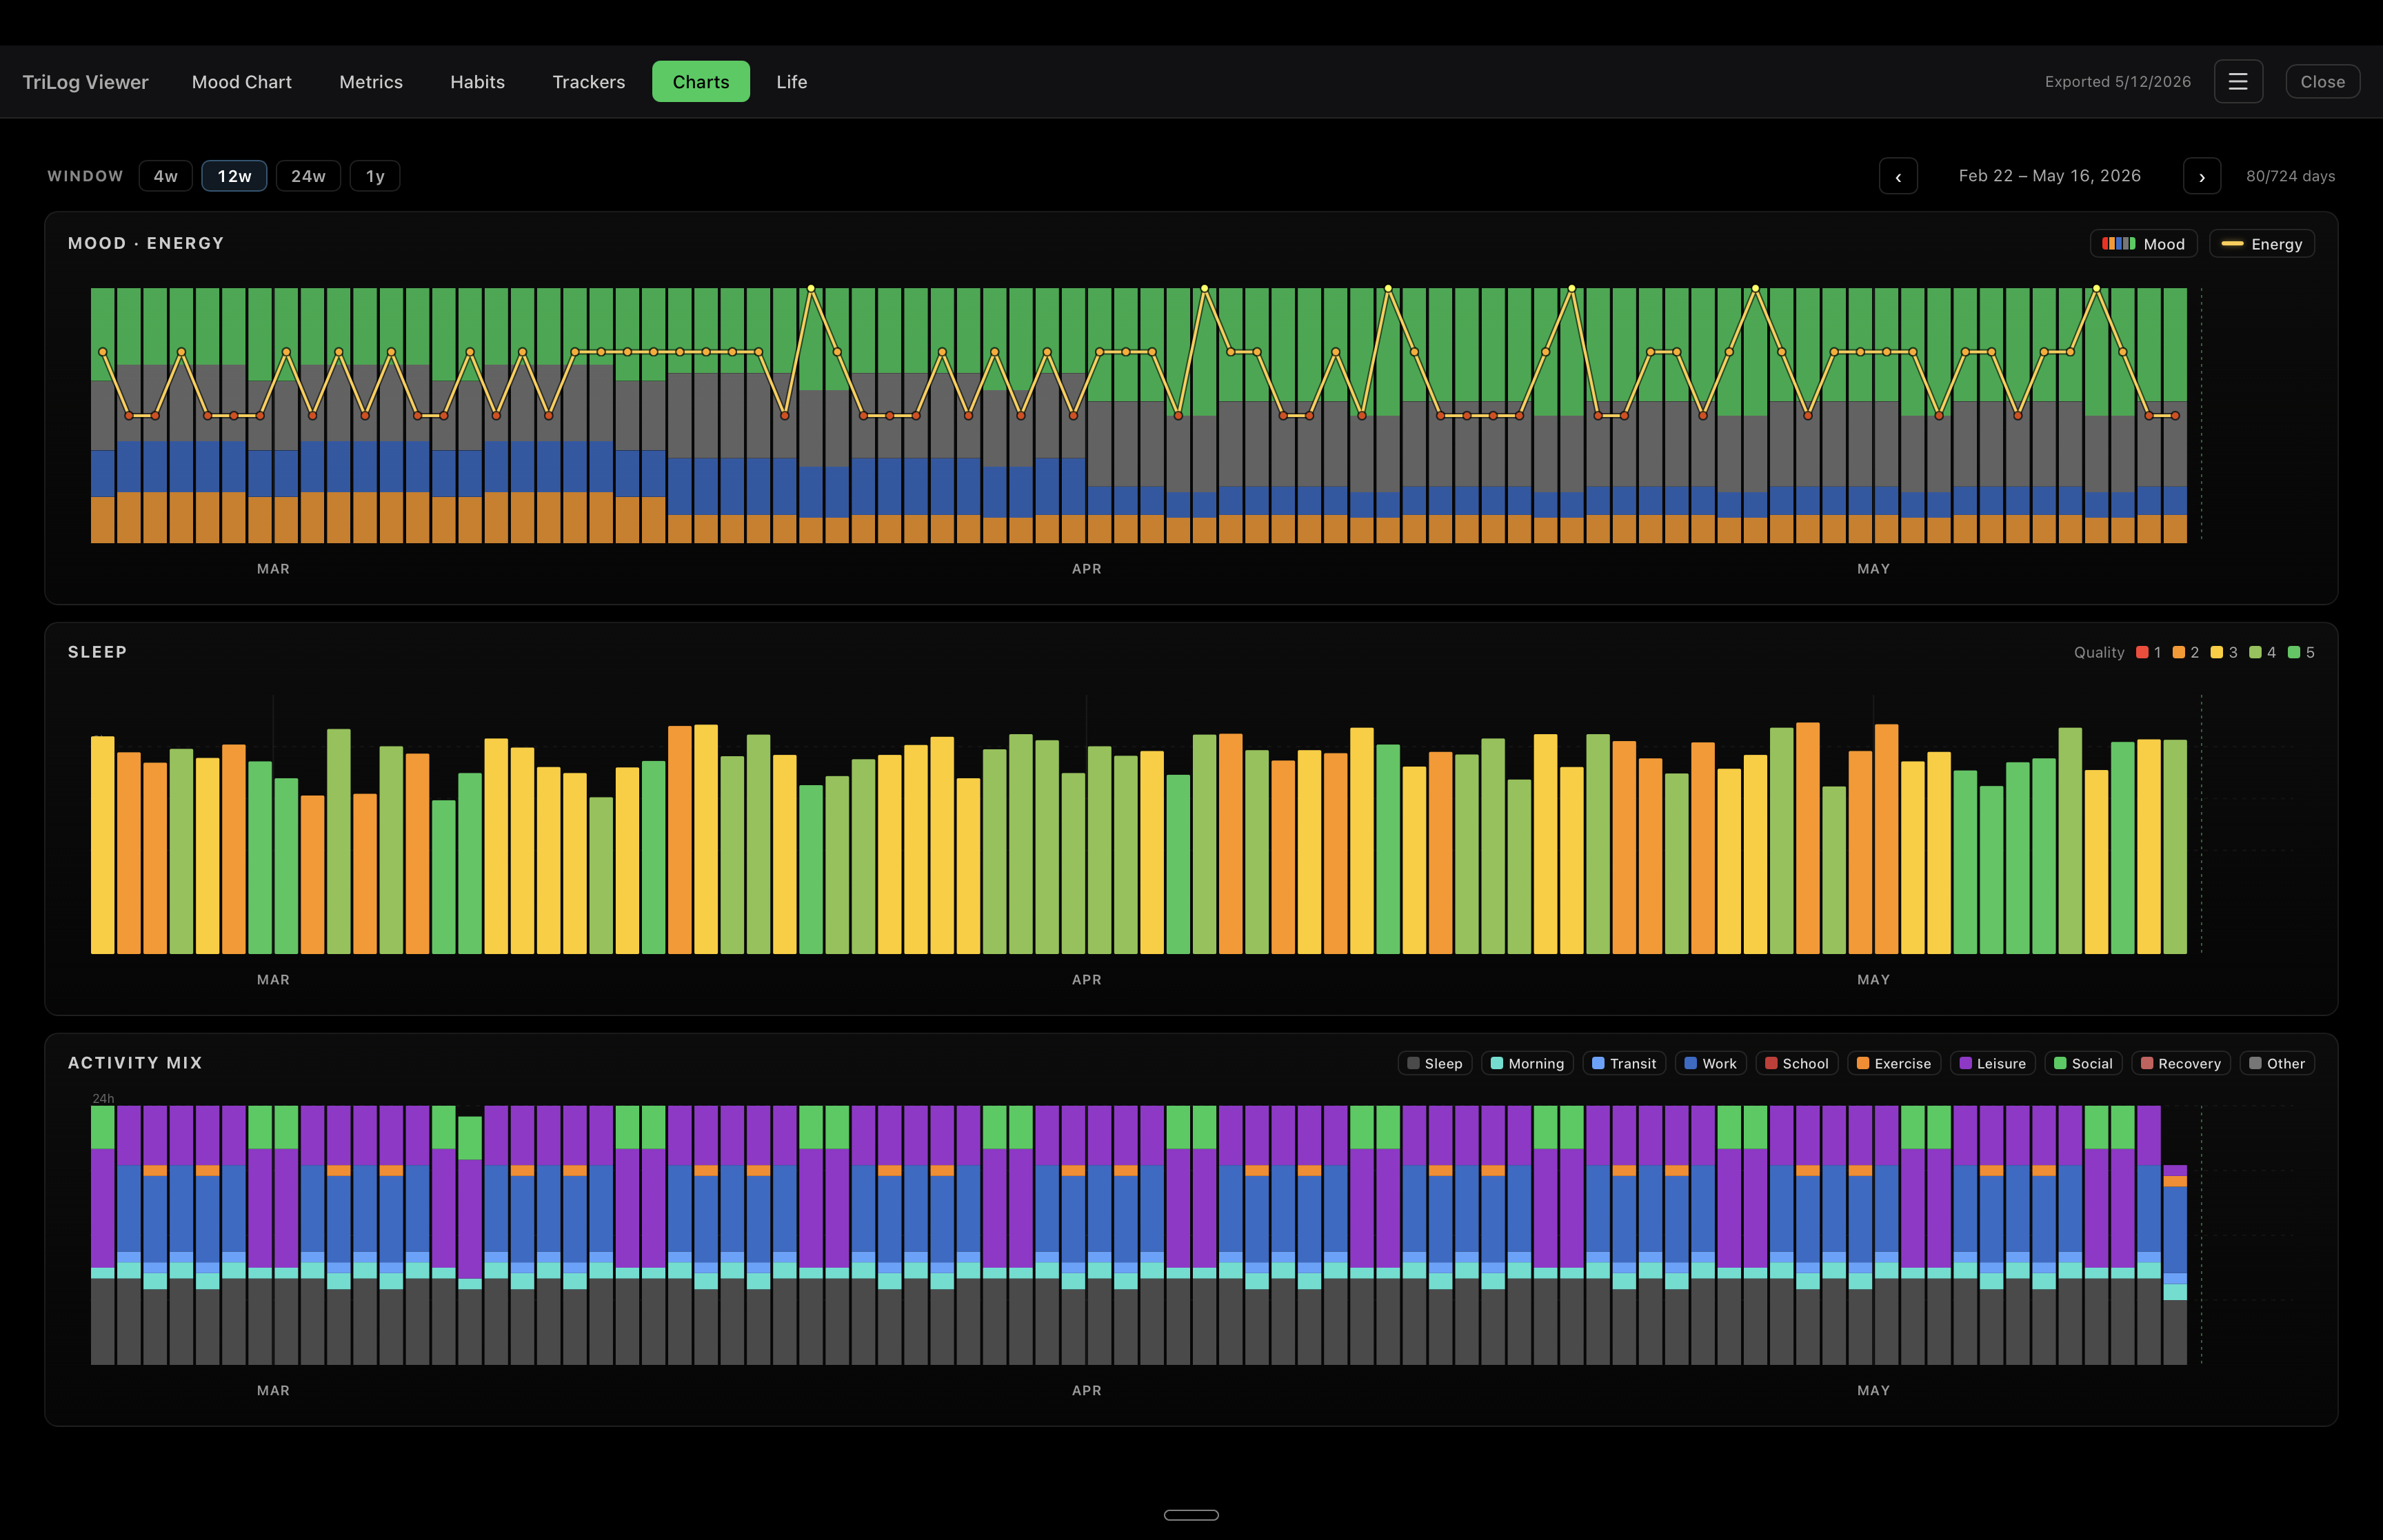
Mood mix + energy · 12 weeks

Per-day mood stack (upset → happy) with the energy line riding on top. Toggle either series off from the header.

Charts tab at 24 weeks showing the energy line by itself

Energy line · 24 weeks

Mood bars hidden, energy alone. Useful for spotting weekly or monthly rhythms without the color noise.

Charts tab at 1 year with both mood-mix bars and the energy line

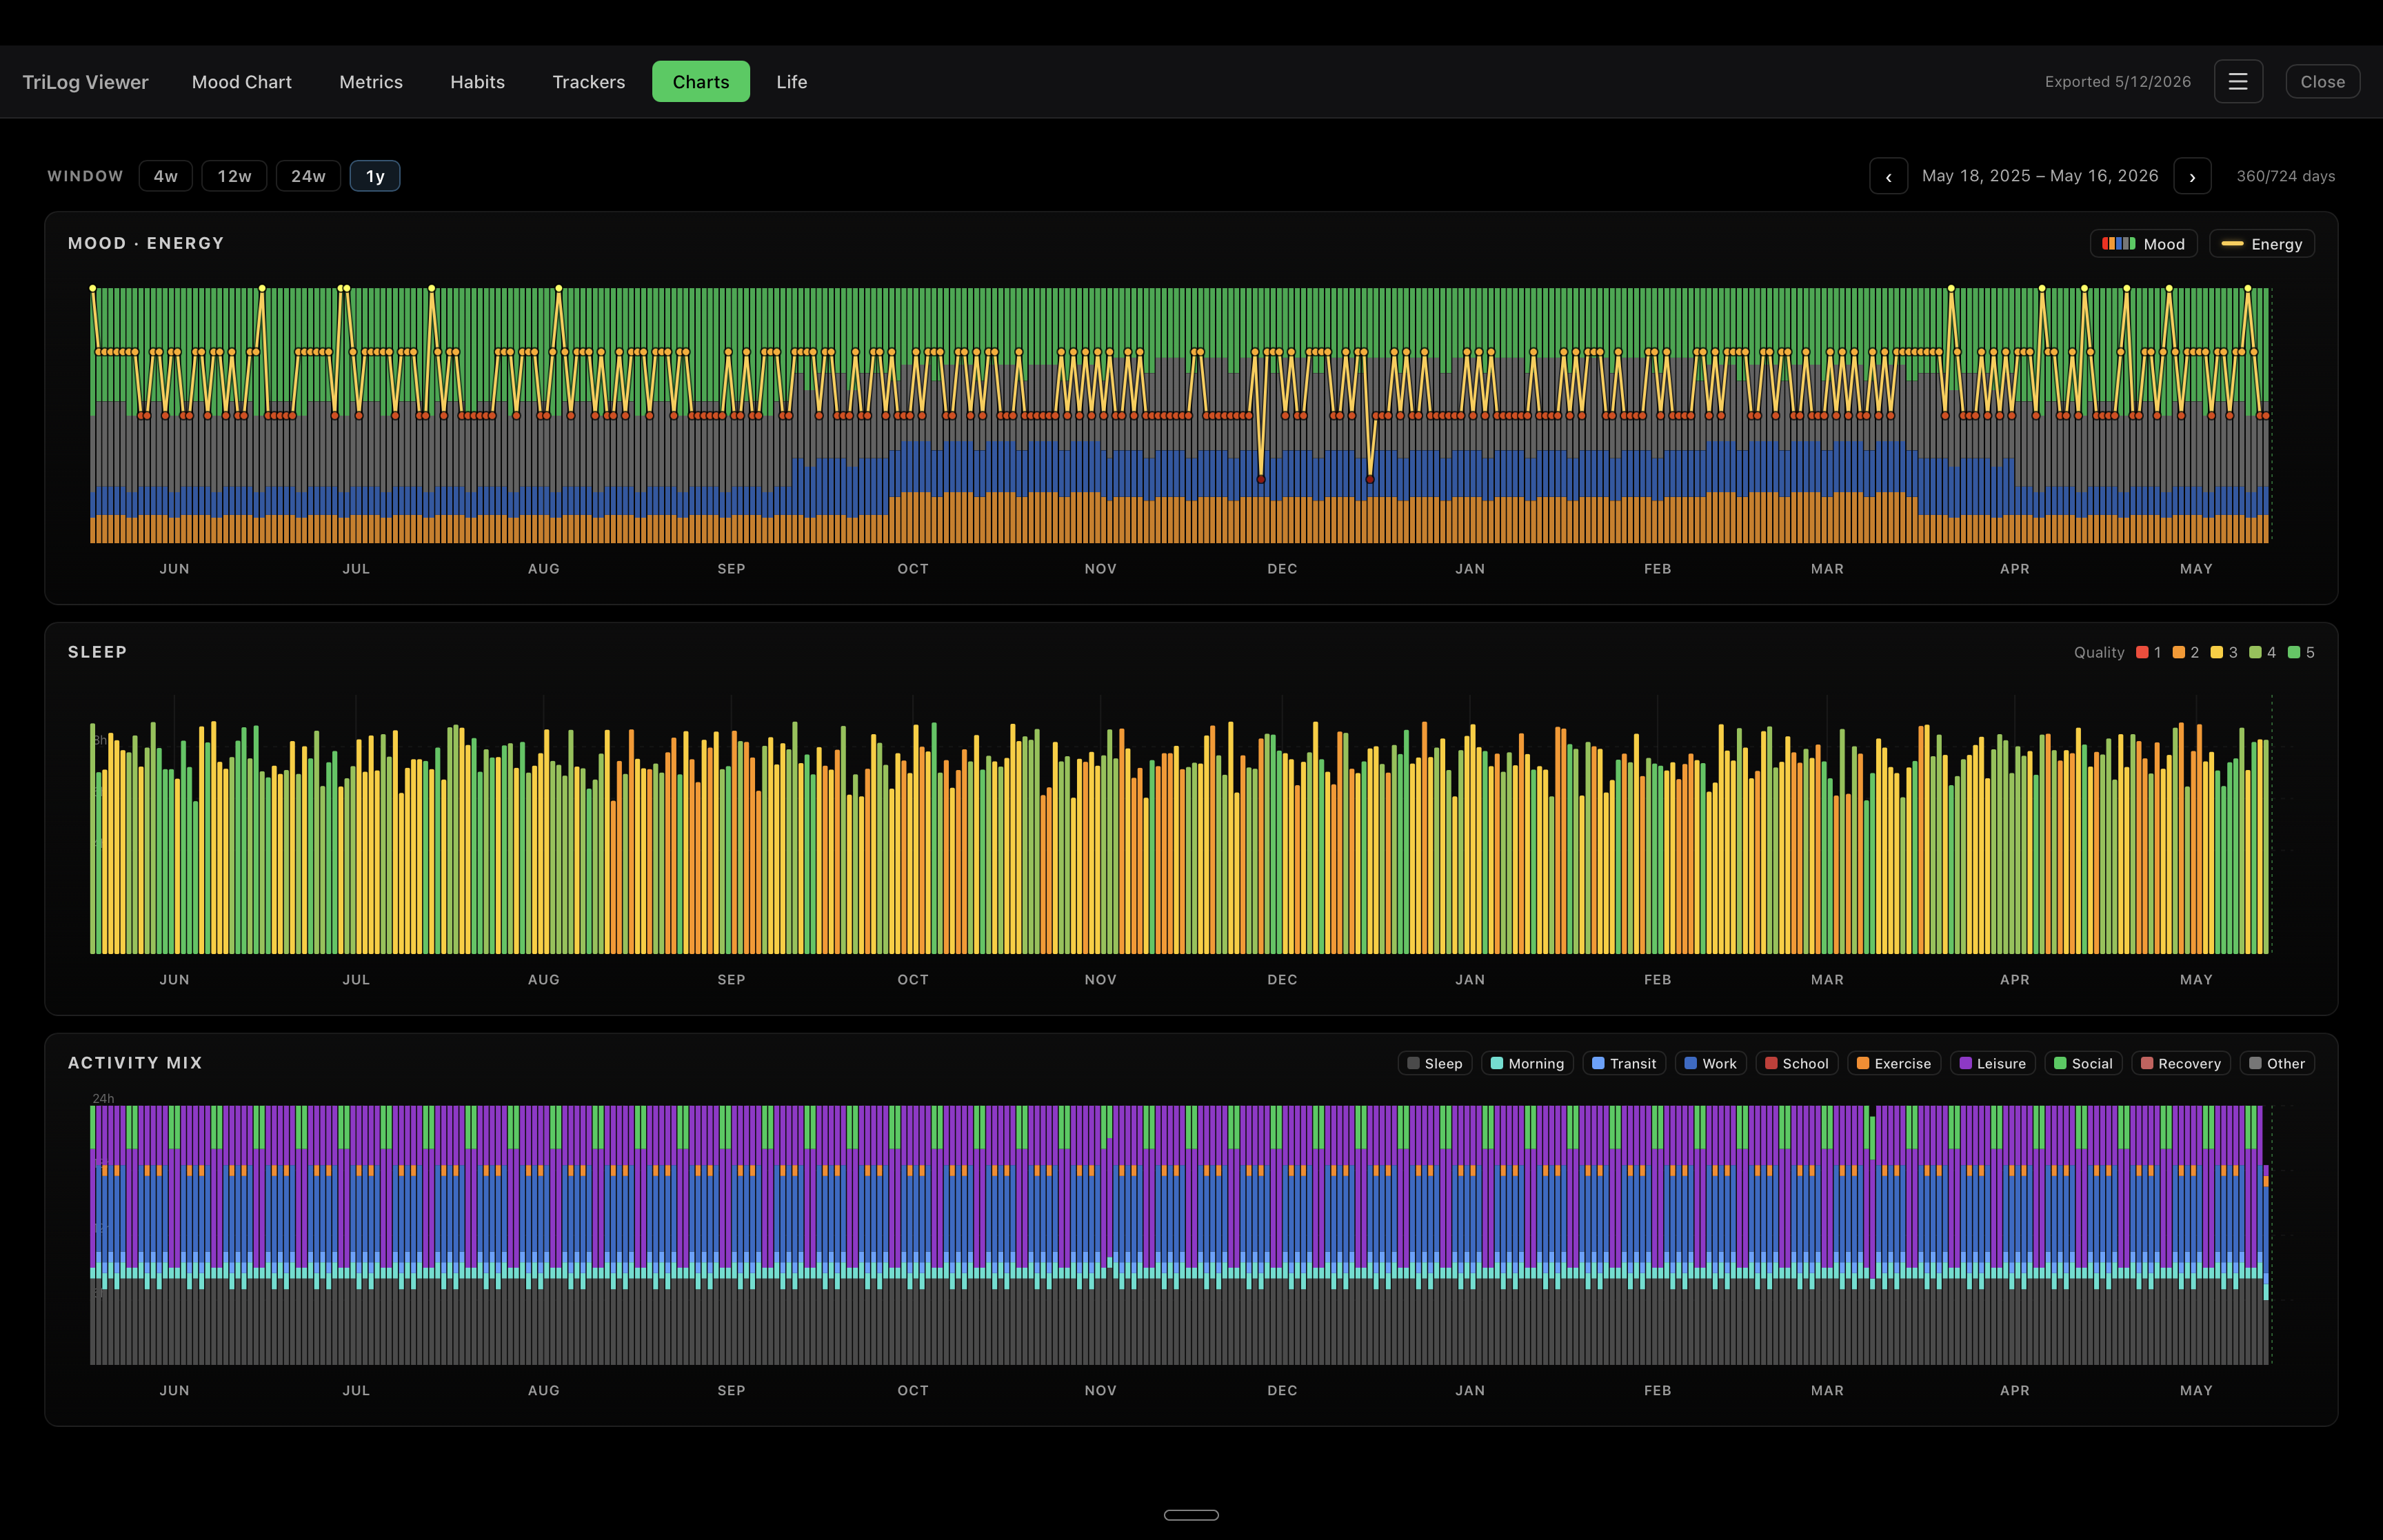
Mood mix + energy · 1 year

A full year on one screen. Long-running trends in the mood mix become visible across seasons.

Charts tab at 1 year showing the energy line alone

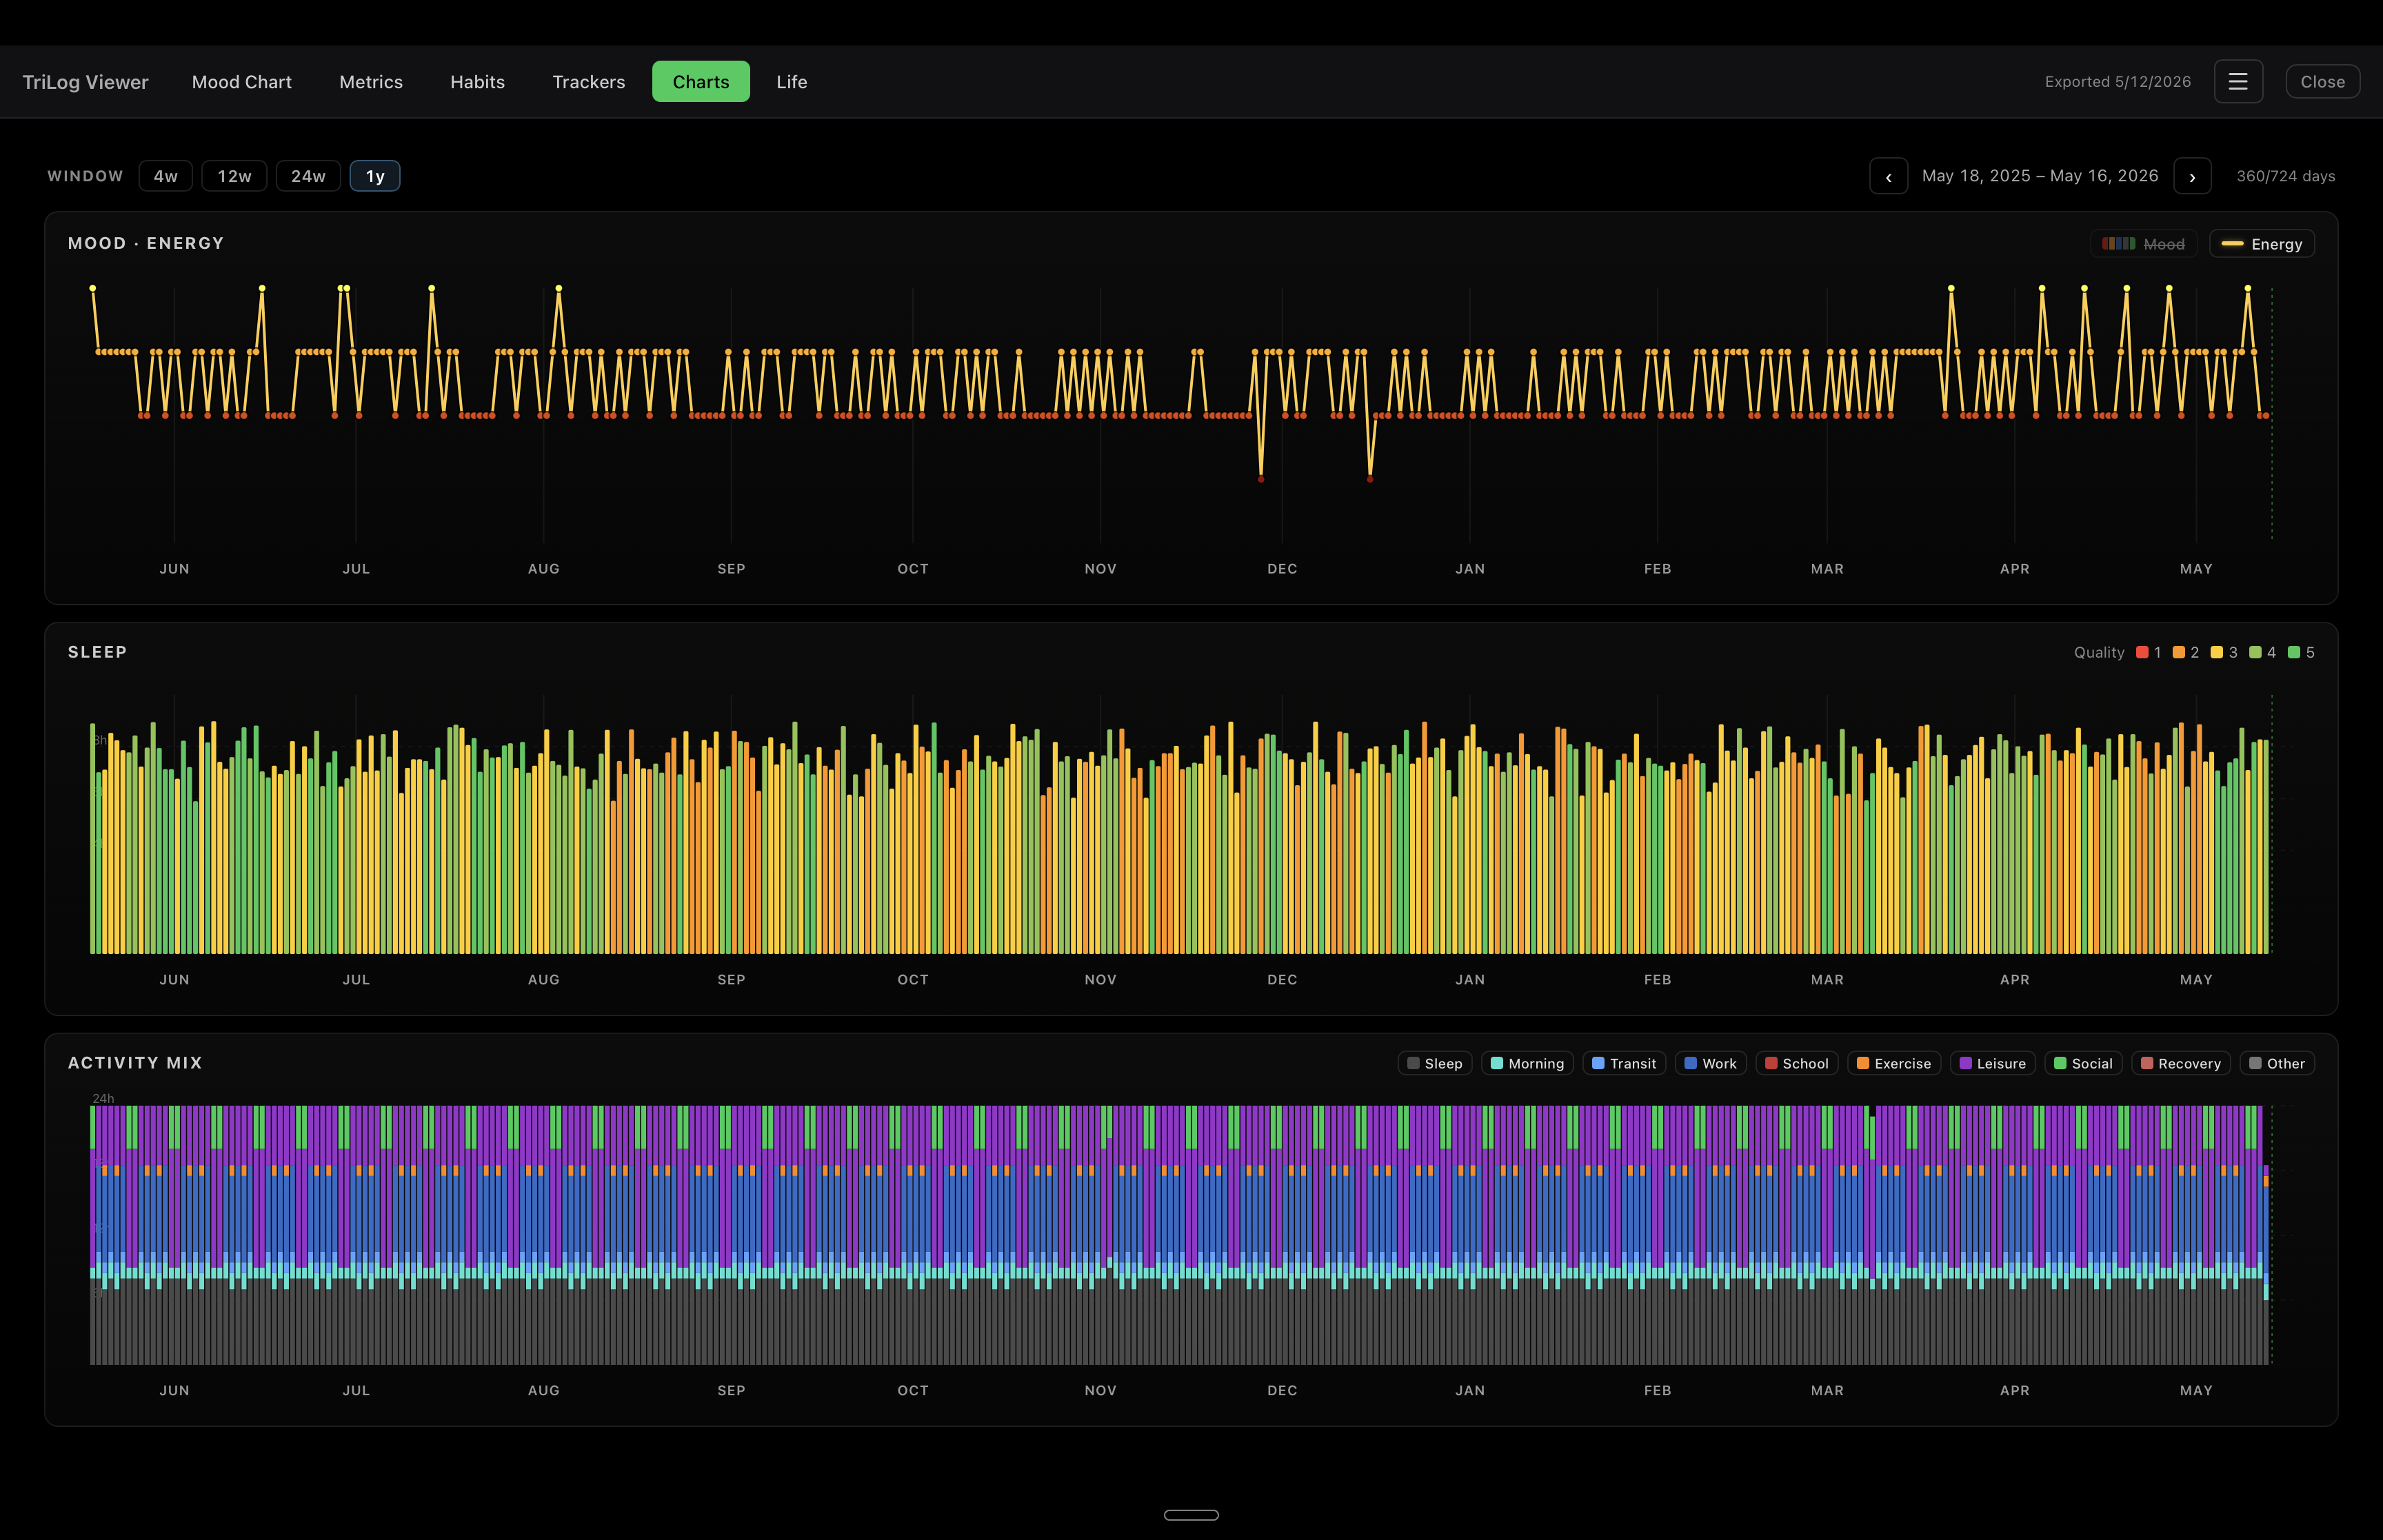
Energy line · 1 year

Whole-year energy at a glance. Annual rhythms, low patches, and trend direction read clearly.

Mood Chart in single-metric mode — 90 days of energy with note markers, moon phases, and weather along the bottom

Single-metric mode

Filter to just mood, energy, or activity and the window stretches to 90 days for the bigger picture. Note markers, moon phases, and the weather strip stay visible so you can read what was going on around each pattern.

Mood Chart with notes hidden

Notes toggle

Hide the note markers when you just want to see the rhythm — same data, less clutter.

Read-only. Offline. Yours.

The viewer never writes to your bundle, never phones home, and stores nothing besides a few local preferences (birthdate, focus horizon, appearance toggles) in localStorage on your Mac.

It cannot edit your TriLog data. Read-only by design. Your iPhone remains the source of truth.

The source is on GitHub under the MIT license. Inspect it, fork it, build it yourself.

Try it now

macOS 11+ universal binary or Windows 10+ installer. Free forever.

Want to try before exporting your own? Download the sample journal (2 years of generated data).